
CiteSpace Bibliometric Visualization
 滑翔闪 included in Software Tools Economic Studies
Because the “Frontiers of Public Finance” course required writing a feedback paper, I took the chance to learn CiteSpace for bibliometric visualization. This post also briefly introduces some other web-based visualization tools, but the focus is CiteSpace.
I wrote this post to record some points the online tutorials leave out and some finer operational details for the new version (6.2.2). Below are the guides written by Jie Li and Chaomei Chen; they also cover the discipline of knowledge graphs, but I’ll show the basic operations directly in this post.
CiteSpace: Tech Text Mining and Visualization
Chinese Guide to CiteSpace, 7th Edition
1. The result
CiteSpace is developed in Java, and the basic version is free while the advanced version is paid; here I only cover the free basic version. The basic version is actually enough.

Visualization of the top 500 cited CNKI papers using “fiscal budget” as the keyword.
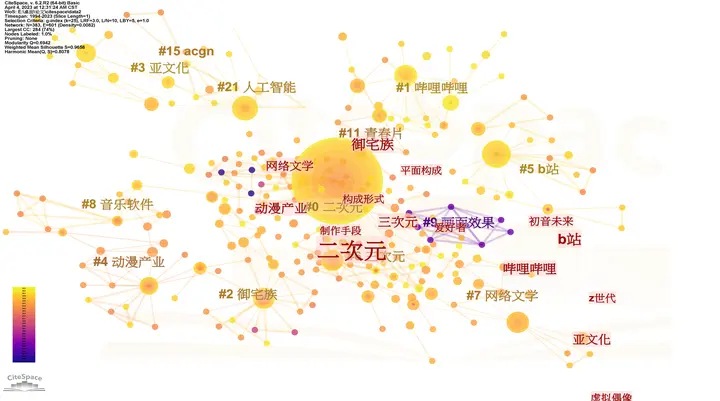
An anime/2D theme; you can see that Bilibili and Hatsune Miku are also third-level keywords (that’s homo for you).


2. Download and the Chinese UI
1. Download page:
As said earlier, CiteSpace is developed in Java, so early versions required downloading Java first1. The latest version bundles jre, so no extra download is needed. Just click in, and like installing ordinary software, click “yes” all the way through.
2. On the install location: I’d suggest keeping the install path free of Chinese characters; it feels like this applies to all foreign software. Personally I feel it doesn’t use much memory, so installing on the C drive is fine too.
3. Chinese UI:
Good news: the new CiteSpace has a Chinese UI. Bad news: not much of it.


By the way, from the top you can see my computer username is “pluck”; I first learned this word because of JOJO.
3. Data import

First create three folders: in, data, project
Personally I suggest saving them in a shallow location that’s easy to click into from “My Computer”; later data processing requires repeatedly clicking to confirm folder locations.
$$ Folder\begin{cases} in: saves the literature information in txt format\newline data: saves the cleaned text literature information from the in folder\newline project: saves the visualization operations \end{cases} $$(1) CNKI data import
1. The CNKI data-selection stage
Note when filtering: “Select all” only selects all results on the current page.
CNKI supports exporting at most 500 records, and CiteSpace (free version) supports processing at most 500 records.
To speed things up, first change the display to 50 per page, then select all across 10 pages to pick out 500 literature records.
To switch CNKI pages, just click where the arrow points in the upper right; no need to scroll down to look.

Choose to export the literature as RefWorks, exporting as a .txt file:

At the same time, CNKI has its own visualization page; we also need to enter CNKI’s visualization analysis following the path in the figure below, and remember the time range of the 500 papers we selected. The time range is very important and will be used later.


2. The folder-cleaning stage
Change the .txt file names to the format download_x so CiteSpace can recognize them. For example: download_1, download_i……
After cleaning, the download_x.txt in the in folder is processed into the data folder; you can check whether the data folder contains the processed text files as a verification.

- Once the txt files in
dataare processed, click “New” on the initial page, - name it in the new popup, and enter the paths for
dataandproject2 - then choose the literature language (English\Chinese) and the database format (usually WoS).

3. The data-analysis page
- As shown, the bottom-right is where you choose the pruning path, trimming unnecessary branches from the relationship graph and keeping the core related literature.
- The top-right is the literature time range, which is why I stressed earlier that you must first use CNKI’s built-in visualization to determine the time range.
- The middle-right is the visualization element selection; usually choose keywords.
- Once selected, click start on the left.
- If all goes well, a popup with a “Visualize” button will appear; click it to start the analysis.

(2) WoS data import
WoS is web of science
Note: since CiteSpace filters journal articles rather than books, you must select the Core Collection; otherwise if there are books later, it may be impossible to proceed!

After that it’s the same as CNKI.
- Export as plain text files; the export limit is also 500 records.
- The exported record content needs to be “Full Record and Cited References”.

After that, the data input just means choosing WoS; the main thing here is deduplication, and everything else is the same as CNKI. Note that in CNKI’s cleaned data folder, there’s only one .txt file, but in WoS’s cleaned data folder, the .txt files correspond to the article’s DOI, keywords, and so on. So don’t doubt whether you made a mistake, or click “Deduplicate” multiple times — that will produce duplicate files!

(3) Supported data sources

Deduplication
Duplicate txt records will affect node computation.
The deduplication function is under the WoS option. Convert the txt documents according to their database source, then deduplicate them in the WoS option.

4. Visualization in practice
(1) Keyword graph
The big watermark behind the new version can’t be removed.


In the graph stage, we usually operate as follows:
$$ \begin{align} &Set nodes to circles:\newline &Nodes\Rightarrow \text{Node Shape for Keywords and Terms} \Rightarrow Circle \newline &Cluster-analysis optimization:\newline &Clusters \Rightarrow \text{Convex Hull: Show/Hide}\newline &Cluster color blocks:\newline &Clusters \Rightarrow \text{Visual Encoding: Advanced Settings} \Rightarrow \text{Areas: Fil/Border Only} \end{align} $$This way you can clearly see the color-block boundaries; if it looks too flashy, click again and it becomes hide, removing the color blocks.


Finer operations: also the most important control page

(2) Timeline view
The controls for the number of keywords and the weighting method in the timeline view are still as shown below.


(3) Burst terms
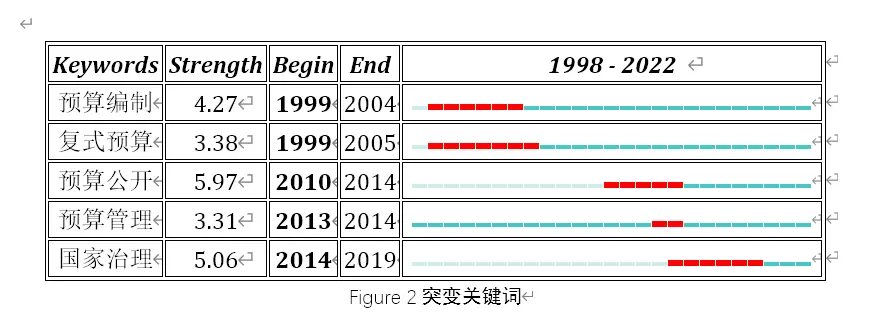
$Hotspots\Rightarrow View$, and they’ll appear; the popup that appears at the same time can be treated as a Word table environment, so you can copy-paste directly.
Pasting into Word with the original format gives you a table that keeps its colors.

This page can be copied and pasted; it’s a Word table format.
(4) Advanced-version operations (pay to win)
It seems the ordinary version used to be able to draw time-zone maps too, but now it can’t; you have to pay for the advanced version. Same for some coupling analyses.
(5) txt tools
If you upgrade to the advanced version, it seems you can process more than 500 literature records3, but CNKI and WoS still cap exports at 500 per batch. In that case you can use a txt merge tool.
(6) Export
You can see there are two watermarks (a big one behind and a small one in the bottom-left); the big watermark behind is new in the new version and can’t be removed.
To remove the bottom-left watermark, do this:


File export supports .png and .jpg. Click the “File” menu in the top-left and a save as pdf will pop up.
Although the bottom-left watermark is superficially removed, it still appears on export,,,,, so if you don’t want any watermark, I’d suggest adjusting the view and taking a direct screenshot.
5. Other bibliometric visualization sites
1. CNKI’s and WoS’s built-in data visualization

2. If you’re a Zotero veteran, that works too.
CNKI’s visualization looks nice; can you take it home? Of course you can.
In another post I introduced Zotero’s visualization plugin, which has a CNKI-like visualization built in.
The petal icon is the toggle; you can resize the window, and there are four visualization relationships. Move to the bottom of the page and the switch options will float up.

Get a visualization of the literature you’ve collected in Zotero.
There’s also a word cloud, though it’s a word cloud of the whole Zotero library’s literature.

3. bibliometric
Supports only the SCI database
4. connectpaper
Just search a keyword directly, and it will associate related literature to form a graph, including sites like arXiv.

5. researchrabbit
Website: www.researchrabbit.ai/
6. Literature reviews?
Can you use CiteSpace to churn out papers? I feel it’s not easy; at least in recent years C-journal papers like that seem rare. But for homework and small projects it seems okay? Though used too much it becomes too formulaic and bland.
Personally, I think a good review should be:
- Having a unique understanding of the whole topic’s depth and prospects: not just describing trends, but grasping the era background behind the hotspots.
So when writing my feedback paper, I tried to combine hotspots and discuss “fiscal budget” and “real-world needs.”
| Keyword | Fiscal extraction | State capital | Budget disclosure | Expenditure structure | Debt management |
|---|---|---|---|---|---|
| Background | Seeking development | Loss of state capital | Corruption | High-quality development\public choice\official tournament model | Economic conditions |
| Time | Founding of the PRC | around 2010 | around 2014 | around 2017 | around 2022 |
- Cleverly classify the existing research directions and theoretical development stages with a framework.
- Grasp the topic’s breadth and timeliness (this is CiteSpace’s strength).
In sum, I personally prefer using CiteSpace to do hidden background work — for example, sorting out the induction route and logic of a literature review’s keywords to help me choose a better topic.