The predecessors have covered it thoroughly; I’ve only lightly stepped in a few pits. Main software: stata, EXCEL, SAS.
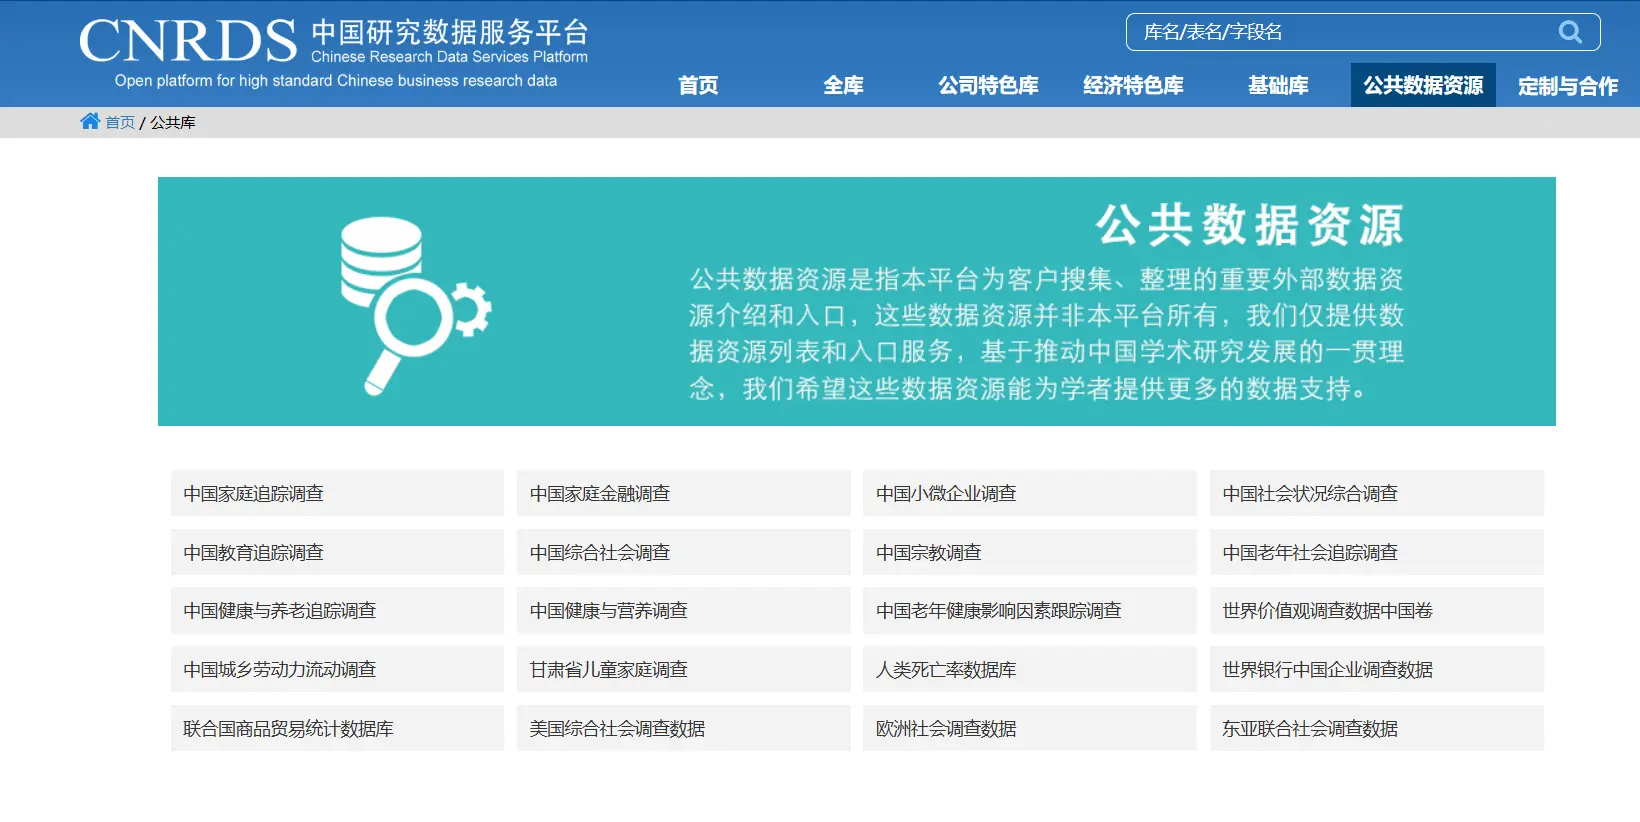
1. Popular domestic databases:
Most microdata database files are mainly in DTA, SAS, and EXCEL formats. They’re split by subject (community questionnaire, household questionnaire, social files) and by theme (background info, health, economy…). Each year’s cross-section data is also separate, so you need to process it into panel data yourself.
Apply on the official site with a student email.
Application experience: CFPS\CHARLS\CHIP\CGSS have a very good application experience. It’s just that the site occasionally crashes and won’t open, so once your application is approved, I suggest downloading all the data right away.
China Education Panel Survey: CFPS is implemented by the Institute of Social Science Survey (ISSS) at Peking University. It tracks data at three levels — individual, household, and community — reflecting changes in Chinese society, economy, population, education, and health, and provides a data foundation for academic research and public policy analysis.
China Migrants Dynamic Survey: A large-scale annual national sampling survey of the migrant population conducted by the National Health Commission since 2009. Its content covers basic information about the migrant population and their family members, migration range and trends, employment and social security, income and expenditure and housing, basic public health services, marriage/childbearing and family planning service management, children’s migration and education, psychological culture, and more.
CMDS has stopped updating
CHARLS: China Health and Retirement Longitudinal Study (pku.edu.cn)
China Health and Retirement Longitudinal Study: China Health and Retirement Longitudinal Study. A large interdisciplinary survey project hosted by the National School of Development at Peking University and executed by the Institute of Social Science Survey, representing high-quality microdata on households and individuals aged 45 and above in China.
Chinese Social Survey: A nationwide large-scale continuous sampling survey project initiated by the Institute of Sociology at the Chinese Academy of Social Sciences in 2005. Its purpose is to obtain data on social change in China during the transitional period through long-term longitudinal surveys of the public’s employment, family and social life, social attitudes, and more, thereby providing detailed and scientific basic information for social science research and government decision-making. Currently, eight waves of CSS data — 2006, 2008, 2022, 2013, 2015, 2017, 2019, and 2021 — have been made open to the public.
China Household Income Project: Launched by the Income Distribution Research Institute at Beijing Normal University1. The project aims to collect household survey data for potentially useful empirical analysis of trends in China after reform and opening up, such as income, inequality, and poverty.
Chinese General Social Survey (CGSS) is China’s first nationwide, comprehensive, and continuous large-scale social survey project. Its purpose is to periodically and systematically collect data on all aspects of Chinese people and Chinese society, summarize the long-term trends of social change, explore social issues of major theoretical and practical significance, promote the openness and sharing of domestic social science research, and provide data for government decision-making and international comparative research.
China Statistical Yearbook: city data, regional data…
The panel data organized from this is all over the internet.
For example, when it comes to measuring urban digital economy nowadays, most people use Zhao Tao’s (2020)2 method, taking the urban statistical yearbook + inclusive finance data as indicators. With the “digital economy” craze, who knows how many people’s first econometrics paper started with digital economy, urban resilience,,,,,,
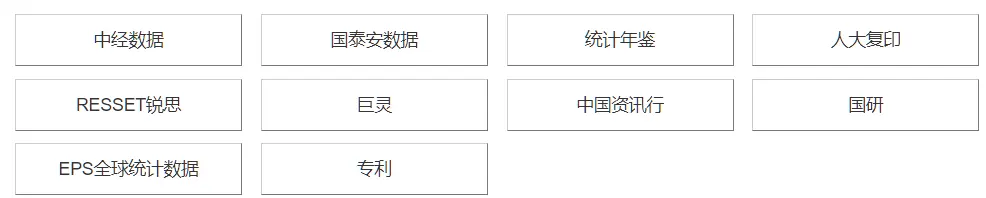
There are also some paid websites (your school may have purchased access3)
Economics also has these paid databases; you can check whether your school has purchased them
Economics also has these paid databases; you can check whether your school has purchased them
I don’t know finance databases very well; Ruisi looks pretty handy
Economics: China Economic Information Network, EPS — directly organizing panel data on the webpage is very handy.
The gray industry of databases on the internet: There are lots of free accounts for sale online, which are basically students pooling their school account privileges into database-access websites.
2. Cleaning approach and its purpose
What exactly does cleaning data involve? Basically these tasks.
Table matching: match and merge different database tables, aiming to integrate and screen indicators, divided into horizontal and vertical matching.
Removing bad data: remove bad data. For example, blank data, extreme data, unneeded data…
Filling in blank data: fill in data. For panel data and time series, we often use linear interpolation to fill in missing values in the middle or at the edges.
Data aggregation: build indicators through specific methods, like principal components, entropy weighting, analytic hierarchy process…
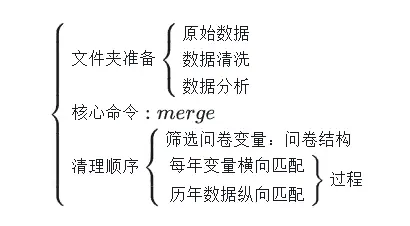
The most important thing is to master the W!O!R!K!F!L!O!W!
When running regressions, “not enough variables”, “lost variables” and other disasters usually happen; we may need to go back at any time to update variables and check where mistakes happened, so keeping a complete workflow folder is very necessary.
Workflow
Rule of thumb!!!!! Keep one folder for raw data, one folder for after table matching, and one more folder for the cleaning process!
Writing code so that it runs smoothly from data cleaning all the way to outputting results in one breath — that’s the highest level of a pipeline!
First, it lets us present each work step for easy checking; second, it makes it convenient to “redo” from any intermediate step.
3. STATA operations
Recommended tutorials
One tutorial video is enough (two hours):
The intro mentions this uploader’s personal github homepage (screen recordings and do files)
Some situations I’ve encountered personally
1. Transcoding when importing Chinese databases
Chinese garbled text — either upgrade your statastata version, or use code
merge is suitable when the identifier of the matching side or the matched side is unique.
For one-to-many matching, e.g. when the master data’s identifier is unique but the matched data repeats, with each repeated identifier row missing different variables, you can use merge’s append-match subcommand to only update the missing part each time.
1
2
use "master_data.dta"
merge 1:m id using "using_data.dta", update nogen force
For many-to-many matching, you need to use joinby.
Shortcuts like Shift\ctrl are basically universal in software design; once you use them a lot, you can apply them to other software too.
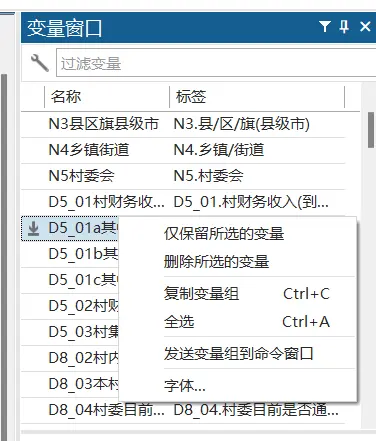
There’s a variable window in the top-right of Stata. Right-click to get select-all and other options; it can also serve as a search box.
Simultaneous selection is ctrl+multiple clicks. If you need to select a dozen scattered variables at once, use it actively.
To select a middle range, click one variable, then shift+click another variable, and it selects the middle range.
For example, you can first right-click, select all, then ctrl+click to remove the variables you don’t want; For example, to check the completeness of specific data, name them “x_i” first during processing, then filter for those named x and select all.
Before python has this kind of window, I won’t consider running regressions superior to stata
4. Interpolation
Linear interpolation, panel data.
As usual for panel data, first mark the individual id and year id,
Similarly, cleaning bad data in questionnaire data is the same loop
1
2
3
4
5
6
7
8
globalvarvar0var1var2var3genshin*packupallthevariablestobeinterpolatedforeachiin$var{dropif`i' == -88
drop if `i'==-99dropif`i' ==.
drop if `i'<=0}
The internet also circulates a “one-click significance” cleaning. The idea is to brute-force permute the control variables, and later even start screening samples. My view: you can look at the control-variable-selection code, but don’t casually touch the samples. A core soul of econometrics is the “randomized experiment”; interfering with sample selection easily breaks data randomness, which is basically fabrication.
(Though purely in terms of code thinking, this does show that once you’ve mastered the filtering, judging, and looping commands, there’s already a lot you can do. The same cleaning task — how you combine the algorithms is what tests the person.)
5. Converting characters to numbers:
For example, the communityID in the charls database exists in character form.
Although Chinese can be used as a variable name to match, when it’s too long stata seems unable to process it. Use the command to force convert to numbers:
Sometimes the date codes we download can’t be recognized by stata, in which case we need the date function.
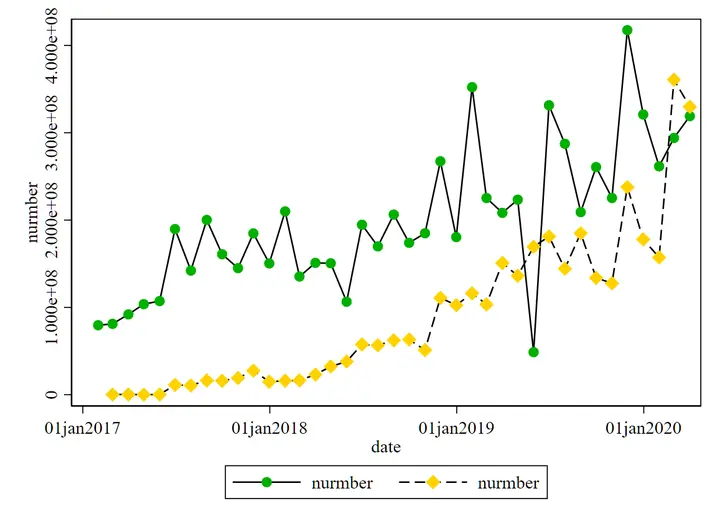
For example, in a class assignment, I wanted to show China’s confidence! Give the teacher a little Chinese shock. (This is China.jpg) I used iiMedia’s Huawei and Apple laptop Taobao data. ps: at the time I also found export trade data for China, Japan, Russia, and the US; data source World Bank.
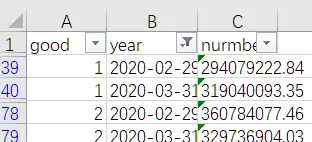
But awkwardly, the date format loaded from Excel was Y-M-D, which stata can’t directly recognize.
2 is Huawei, 1 is Apple; sales is number, date is the year column
Green is Apple, gold is Huawei. You can see that after processing, date becomes a special date form, and it can be directly used to draw scatter plots in stata. The original plot is gone, so I just redrew it simply; please ignore this garish color scheme
Green is Apple, gold is Huawei. You can see that after processing, date becomes a special date form, and it can be directly used to draw scatter plots in stata. The original plot is gone, so I just redrew it simply; please ignore this garish color scheme.
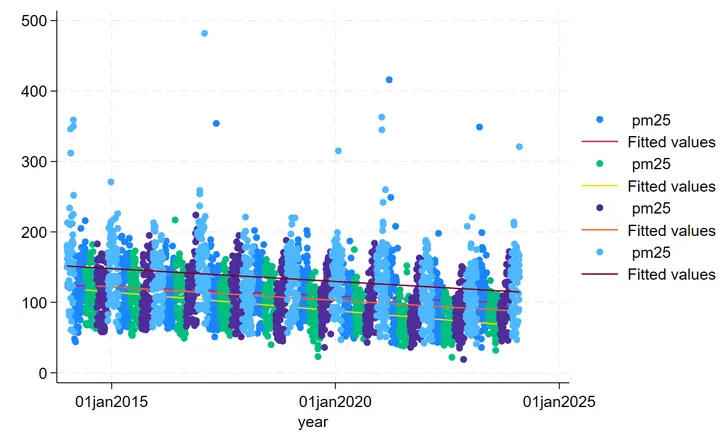
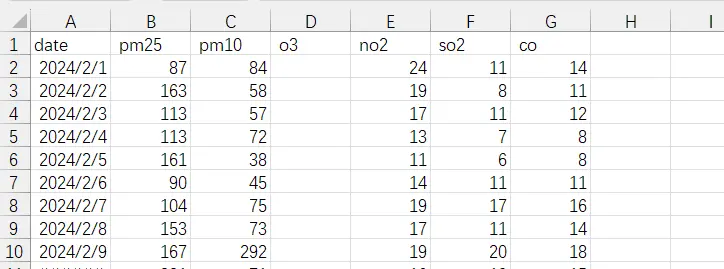
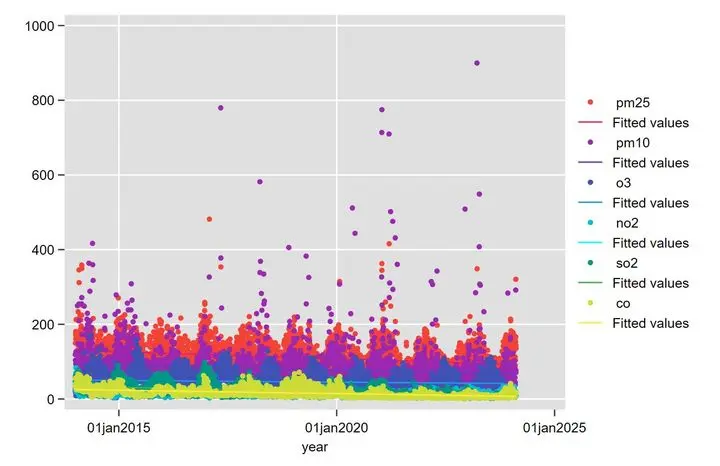
Another example, a dataset about air pollution. In Excel, the date column is in “short date format”
Fitting by season classification shows the linear trend is more obvious. We find temperature and pollution are correlated, which is why the previous plot shows periodicity; we can also hypothesize that the lower the temperature, the more heating, heated beds, and coal use, leading to more air pollution
7. Deletion and conditional statements
Stata’s command to delete specific columns is the drop command.
I suggest directly typing “h drop” to view the help.
Making good use of if conditions and forvalues loops is when algorithmic ability is tested!
What kind of data do you need to process, and what is your goal?
How can the goal be decomposed, into what flow, which if conditions filter faster, and which forvalues loops can simplify your cleaning steps as quickly as possible?
Make good use of stata’s do files and consider code reusability, so that after writing code, it can be reused in loops later, e.g. by only changing variable names.
I recommend custom delimiters, which makes plotting commands more elegant:
1
2
3
4
5
6
7
8
9
10
11
12
13
#delimit;;gendi=year-branch_reform;eventddentre_activationi.yearlnagdpindust_strufinanceainternetmarket,timevar(di)//define the time dummy variable
ci(rcap)//error bars
noline//don't plot the confidence interval bar for period -1
method(fe)//to add autocorrelation clustering — method(fe,cluster(autocorrelation clustering))
baseline(0)//base year is 0
level(95)graph_op(ytitle("coefficients")xtitle("Time")xlabel(-10(2)14));// cancel the custom line break
#delimitcr
twoway///(linevar2dateifgroup==1)///(linevar2dateifgroup==2)///(linevar2dateifgroup==3)///(linevar2dateifgroup==4)///(linevar2dateifgroup==5)///(linevar2dateifgroup==6)///(linevar2dateifgroup==7)///(linevar2dateifgroup==8)///(linevar2dateifgroup==9)///(linevar2dateifgroup==10)///(linevar2dateifgroup==11)///(linevar2dateifgroup==12)///,///legend(order(1"group1"2"group2"3"group3"4"group4"5"group5"6"group6"7"group7"8"group8"9"group9"10"group10"11"group11"12"group12"))///title("Line plot")///note("The Stata Guide",size(vsmall))
Pie chart
1
2
3
4
5
6
graphpievar2ifgroup<=10,///over(group)plabel(_allpercent,format(%9.2f))///line(lcolor(black)lwidth(vvthin))/////outlinecolorshavetobemanuallyaddedtitle("Pie plot")///note("The Stata Guide",size(vsmall))
Box plot
1
2
3
4
5
graphbox///var*///,///title("Box plot")///note("The Stata Guide",size(vsmall))
Histogram
1
2
3
histogramvar4,percent///title("Histogram")///note("The Stata Guide",size(vsmall))
graphbar///var*///,///blabel(bar,format(%9.2f))///title("Bar graph")///note("The Stata Guide",size(vsmall))
Horizontal bar chart
1
2
3
4
5
6
7
8
graphhbar(mean)///var*///ifgroup<=6,///over(group)///percentagesstack///legend(order(1"Var 1"2"Var 2"3"Var 3"4"Var 4"5"Var 5"6"Var 6"))///title("Bar graph")///note("The Stata Guide",size(vsmall))
Confidence interval
1
2
3
4
5
6
7
twoway///(lpolycivar1var9,fcolor(%80))///(lpolycivar2var9,fcolor(%80))///(lpolycivar3var9,fcolor(%80))///,///title("Confidence Interval")///note("The Stata Guide",size(vsmall))
Range plots
1
2
3
4
5
6
twoway///(rcapsymvar2var3dateifgroup==1,sort)///(rcapsymvar2var3dateifgroup==2,sort)///,///title("Range plots")///note("The Stata Guide",size(vsmall))
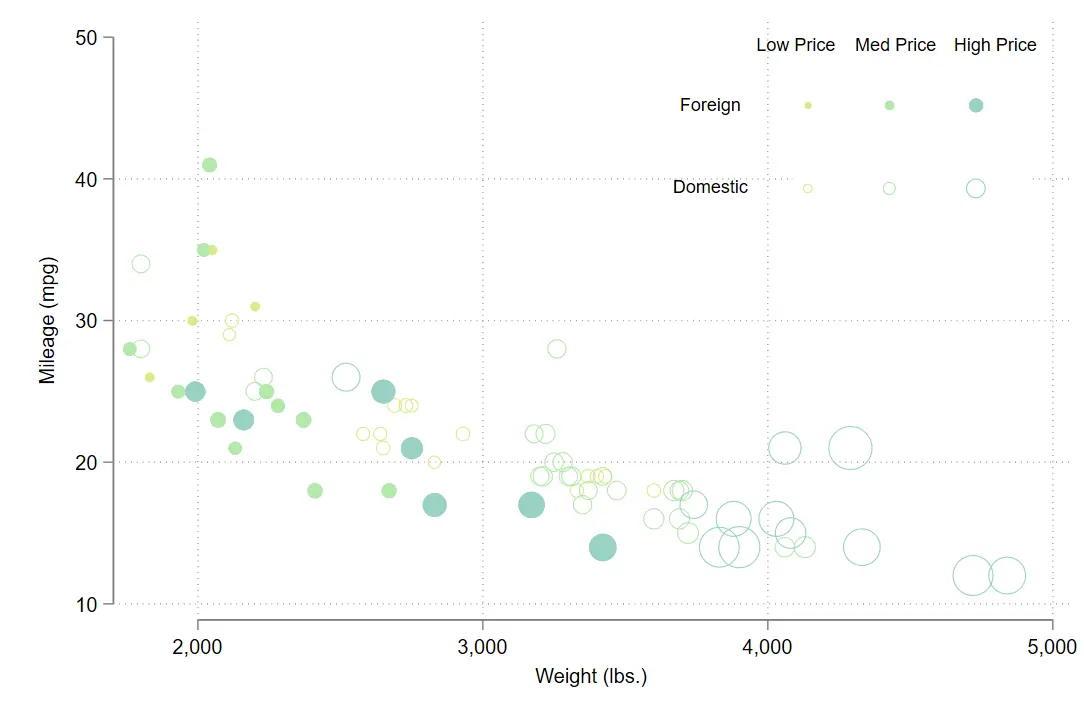
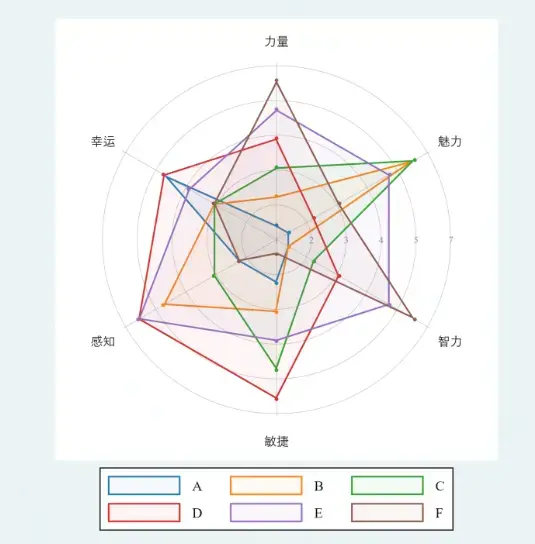
I personally recommend the Rainbow and gg_tableau styles the most.
The gg series imitates R’s default style. Rainbow is very bright, distinctive enough, and I also like the closed box with a pure white background. But note that the Rainbow style has a grid background by default, which makes customizing reference lines a bit inconvenient.
Here firstrow (variables) means the excel row keeps the variable names “data.xlsx” is the name of the file you save Correspondingly, to specify a save location, you can change it to “E:\Desktop\New folder (2)\stata\merge.dta”
5. EXCEL
0. Common garbled text
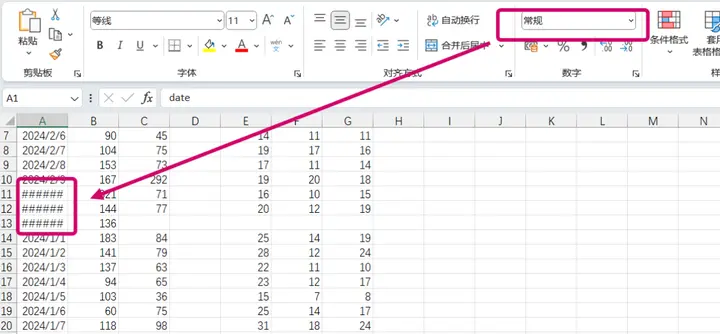
Some garbled excel/csv text like the ones below is due to wrong formatting. For example, in the figure below, adjusting the text box format to date fixes it.
img
1. The VLOOKUP function
After using it a lot, I feel stata is much faster than Excel. For example, I did a task on descriptive statistics of rural revitalization levels, where I needed to show the number of villages above the mean for each indicator. In Excel this is fairly troublesome, involving judgment (if you haven’t mastered VBA); stata handles it much faster.
The easiest data to find and analyze in economics is definitely urban panel data, and city code matching is unavoidable
Please refer to: link, which thoughtfully includes the city codes; many thanks!
When using the vlookup function, you may also encounter a situation; excel’s format settings are truly bizarre!
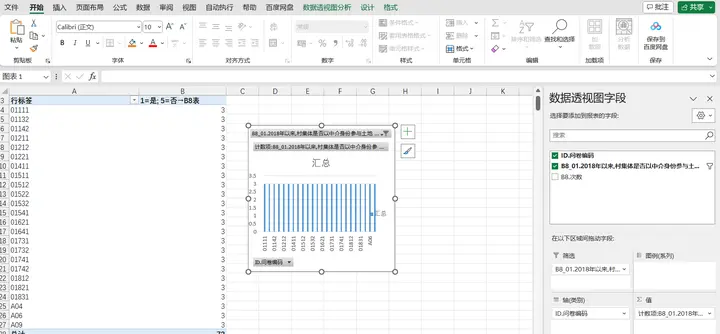
2. Pivot tables
Use it for simple counting and relatively complex grouped summation during cleaning.
Insert - PivotTable. Excel’s current feature is quite smart, mainly very handy for cleaning panel data that needs accumulation.
Note: the pivot table’s “sum function” requires the excel format to be “number”, while the “count function” has no format restriction. Sometimes data imported from excel
imghas a format defaulting to “text”, and needs adjustment (at least first set it to “general” format).
3. Splitting text
As far as econometrics goes, the current top-tier approach is DID. If your school has a student econometrics paper competition, it’s very likely pure “difference-in-differences” hand-to-hand combat (dog head) When doing DID, we need to manually record the policy variables. For example, smart cities and innovation cities piloted in three batches over several years. At this point we can’t foolishly copy-paste one by one; please use Excel’s text splitting.
For example, splitting the set of pilot cities “Beijing, Chongqing, Tianjin, Shanghai”,
you can select that cell, $Data\Rightarrow Text to Columns$,
In the “Text to Columns Wizard” dialog, choose “Delimited”, click “Next”, and check “,” in “Delimiters”.
At this point the rows are split. Then combine with the VLOOKUP function to match.
4. Deleting and modifying characters
Clever use of vlookup already handles most situations, but still not enough! The pits of data cleaning are hard to guard against
Some Excel files have cityid as 1100, some as 110000 Some say Chengdu, some say Chengdu with the word “City” tacked on!
Look at the big screen! At first I thought Excel was quite beginner-ish to use this way, but after learning stata I realized merging data files is far more efficient than Excel.
6. Closing
These days the Jinggu forum (经管之家) shut down,
and I realized there’s nowhere to ask many basic stata questions,,,,,
90% of the problems were solved by methods found on Zhihu, the Jinggu forum, and Bilibili.
Indeed the predecessors have covered it thoroughly; I’ve only lightly stepped in a few pits.
References
The chip\cfps websites often crash, which is quite annoying ↩︎
You can look into your own school’s library resources ↩︎
The province and city matched by the database sample id are in the 2013 data on its website, and are continued afterward but no longer updated in other years ↩︎

 滑翔闪 included in Software Tools Economic Studies and Stata Empirical Tools