
Econometrics: Event Studies 3
 滑翔闪 included in Economic Studies and Event Studies
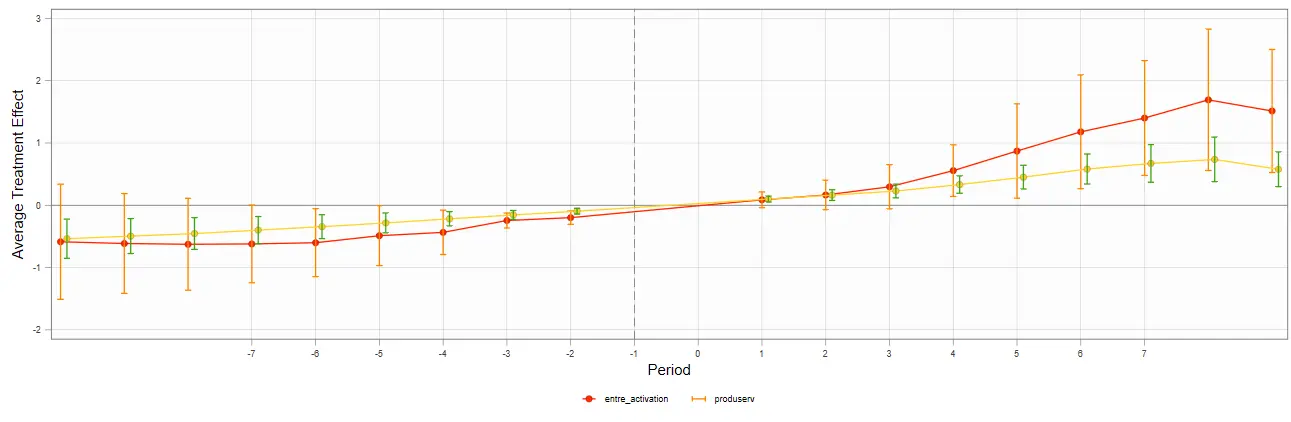
This post is a record of learning the code from An Introductory Guide to Event Study Models. The third part tackles the Stata code.
This post introduces the plotting code for the coefplot, eventplot, eventdd, and cnreg commands in event studies.

A quick review of the event study concept
Operationally: a regression usually estimates an average treatment effect, while an event study slices that average effect over time.
Statistically: each dummy time period gets a coefficient, and stringing them together shows the dynamic evolution of the average treatment effect.
The average estimate:
$$ y_{ij}=\beta X_i+\underbrace{\alpha_{i}+\delta_{i}}\_{\text{面板固定效应}}+\underbrace{\beta\cdot X_{ij}}\_{\text{ 控制变量}}+\epsilon_{ij}. $$After time-slicing:
$$ y_{ij}=\underbrace{\left(\sum\_{j\in\{-m,\ldots,0,\ldots,n\}}\gamma_{j}\cdot D_{i,t-j}\right)}\_{\text{事件时间虚拟变量}}+\underbrace{\alpha_{i}+\delta_{i}}\_{\text{面板固定效应}}+\underbrace{\beta\cdot X_{ij}}\_{\text{ 控制变量}}+\epsilon_{ij}. $$A parallel-trends test is just a special case of an event study. Say there are two counties, A and B. County A implemented rural revitalization and B didn’t, and then A got rich.
We can’t casually say rural revitalization caused A to get rich — A might have been blessed to begin with: beautiful scenery, fertile soil, rich mineral resources…… A and B have always had a development gap. To verify that A and B’s data were nearly identical before rural revitalization, that way the DID event is exogenous to both counties.
In short, the parallel-trends test argues that the treated and control groups had almost no difference before the event.
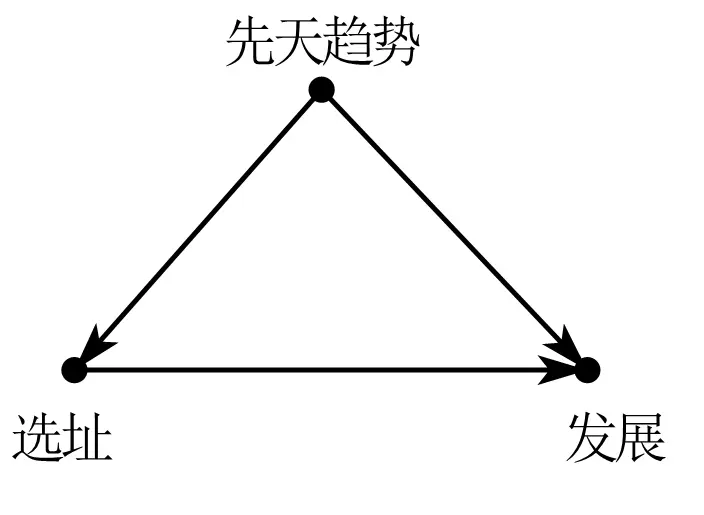
By the way — panel data generally defaults to two-way fixed effects, and the coefficient bias in parallel-trends tests with three or more periods has long been a hot research topic.
The core sticking point is decomposing heterogeneity: some variables have time trends and some don’t; different pre-trend shapes call for different constraints.
But in practice, nobody actually knows these population-level facts.
Event studies in top journals
In the top-5 papers I’ve read, there’s already a trend — anything that can be shown in a figure gets a figure. So event studies are being used more and more often.
For example, see the post One-Time Government Investment and Long-Run Manufacturing Growth.
Here I’ll give examples from papers I like that use event studies flexibly.
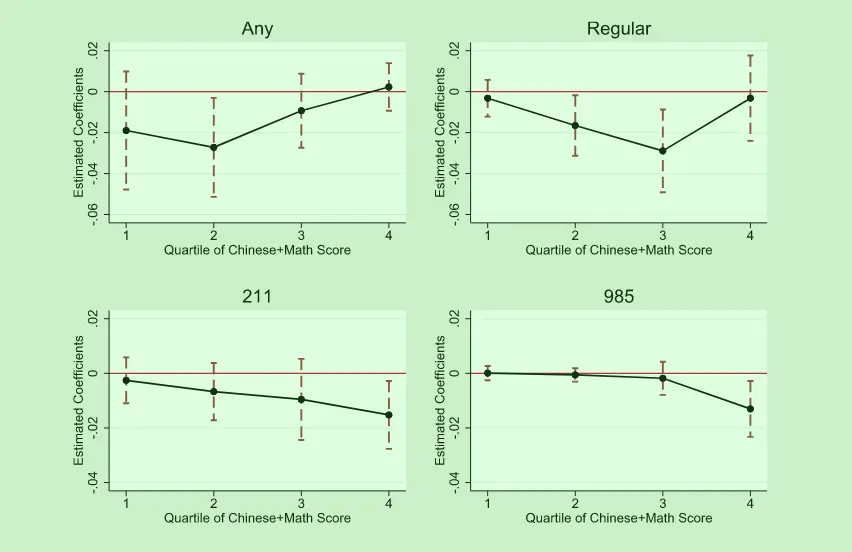
JDE’s English language requirement and educational inequality: Evidence from 16 million college applicants in China uses event studies to argue that the English listening exam widened urban-rural educational inequality.
It uses event studies to show the heterogeneity in how gaokao students stratify — from 985 universities down to first-tier admission rates, the effect keeps growing.
QJE’s The Long-Run Impacts of Public Industrial Investment on Local Development and Economic Mobility: Evidence from World War II uses event studies to argue that during the Cold War, the US dispersing factories raised the future wages of local children.
Through dynamic comparisons swapping in different variables, you can see that the number of local firms barely changed, but employment grew markedly — so the job growth came from scale effects rather than a rise in the number of firms.
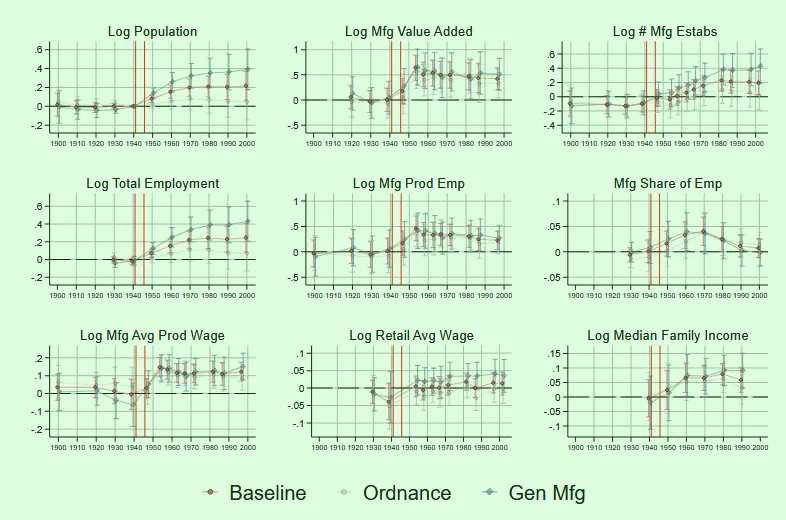
Later it also uses a population-flow panel to argue that the wage gains came from better local job pay rather than human-capital gains or in-migration.
Stata code
The example data below is from China Industrial Economics’ Does Innovation-Driven Policy Boost Urban Entrepreneurship Activity — Evidence from the National Innovative City Pilot Policy.
Honestly I wanted to use data I collected myself as an example, but not a single coefficient was significant! 🤧
The data are all in the journal’s online appendix; just go in and download them. This paper should also be one of the earlier domestic papers to publicly release the full difference-in-differences code. City-level panel data is handy for learning any kind of code.
Two ways to do the parallel-trends test
The coefplot command
The coefplot command can extract regression coefficients. We just need to generate time dummies, run the regression, and then store the coefficients via the command and plot them.
Steps summarized:
- Define the panel data
- Set the event time — year minus the event time — then generate the dummies for each time slice in turn
- Regress
- Store the coefficients and plot
| |
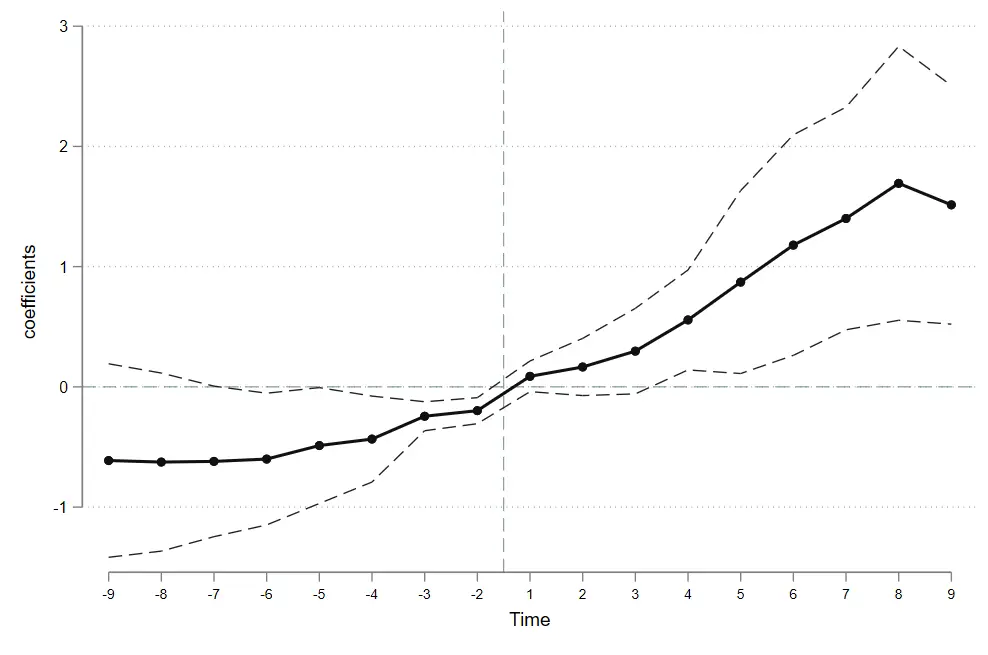
The Eventdd command
The Eventdd command can draw the plot in one step; just enter the corresponding parameters following the code below.
Whatever variable follows Eventdd is the regression to run.
| |
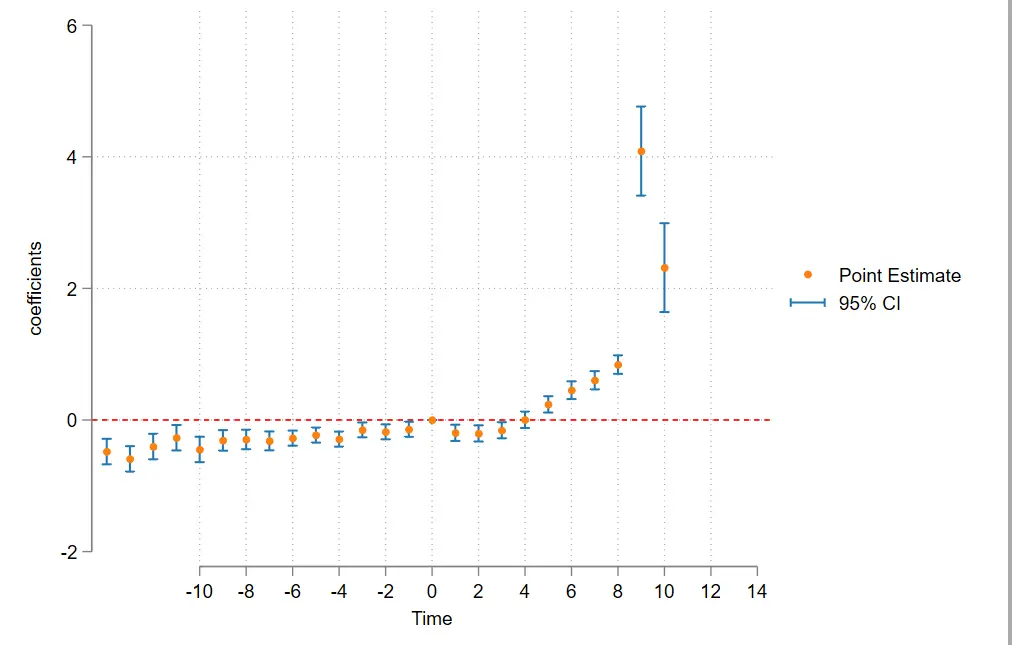
Regression tips for parallel trends
The specification I chose is:
| |
- Here
i.city#c.diadditionally controls for each unit’s time trend (the time effect decomposes the intercept, while this decomposes the slope). - The
d_1period is dropped: on one hand to serve as the baseline, on the other to avoid collinearity. - Some papers subtract the coefficient mean to make the plot prettier, but it’s not necessary.
- The parallel-trends test has plenty of bias controversy, but nobody really scrutinizes these points; doing them is just better.
Constrained regression
Following the code in An Introductory Guide to Event Study Models, we can add constraints to the regression.
Just use the cnsreg command. I already explained it in Econometrics: Event Studies 2. In the coefplot command, just swap the regression for the constrained one.
The constaint command sets the constraints; adding c (1-5) in the regression adds all five constraints. Got it? 😉
| |
Showing multiple regression coefficients on one plot
The twoway command can also do it, but it’s too much trouble, so I won’t cover it here.
The Coefplot command
Still use the coefplot command; other parameters can still be added — but you can’t set line parameters (addplot).
| |
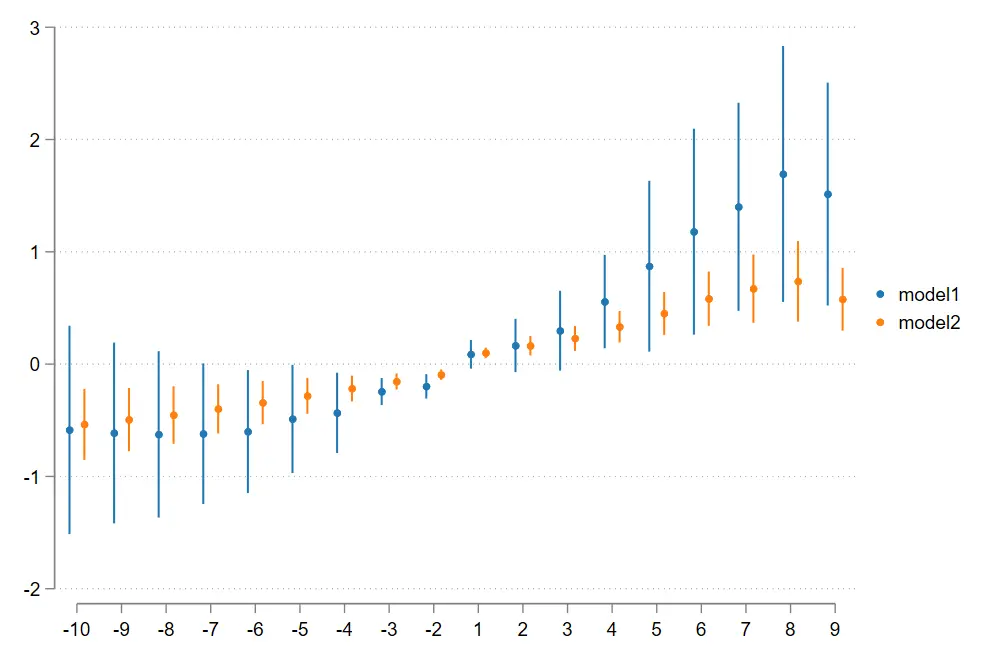
If you don’t want to show them on one plot, just add a separator like the other commands.
| |
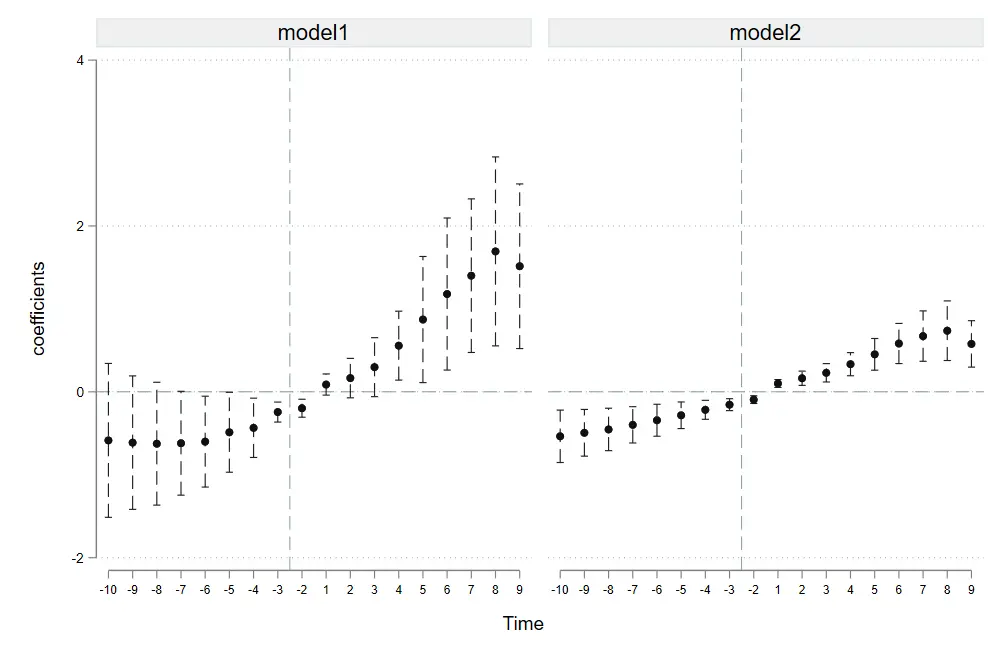
The Event plot command
I’d guess most publications with connected-line plots, if they aren’t using R, drew them with the event plot command.
The nice thing about this command is that you can set different reform years for comparison, and it supports connected scatter plots. It also seems to have many good subcommands aimed at difference-in-differences.
I’d bet the QJE paper mentioned above drew its figure with this command.
| |
The plottype(connected ) part is what sets both a connecting line and markers.
Stub_lag (post# post# fpost#) stub_lead (pre_# pre_# fpre_#) — if the three models share one x-axis, you only need to enter the shared x-axis symbols. But here, for testing, I shifted the reform year of one model (model 3) earlier, so they need to be matched one-to-one; even for the same coordinate you have to write it out repeatedly.
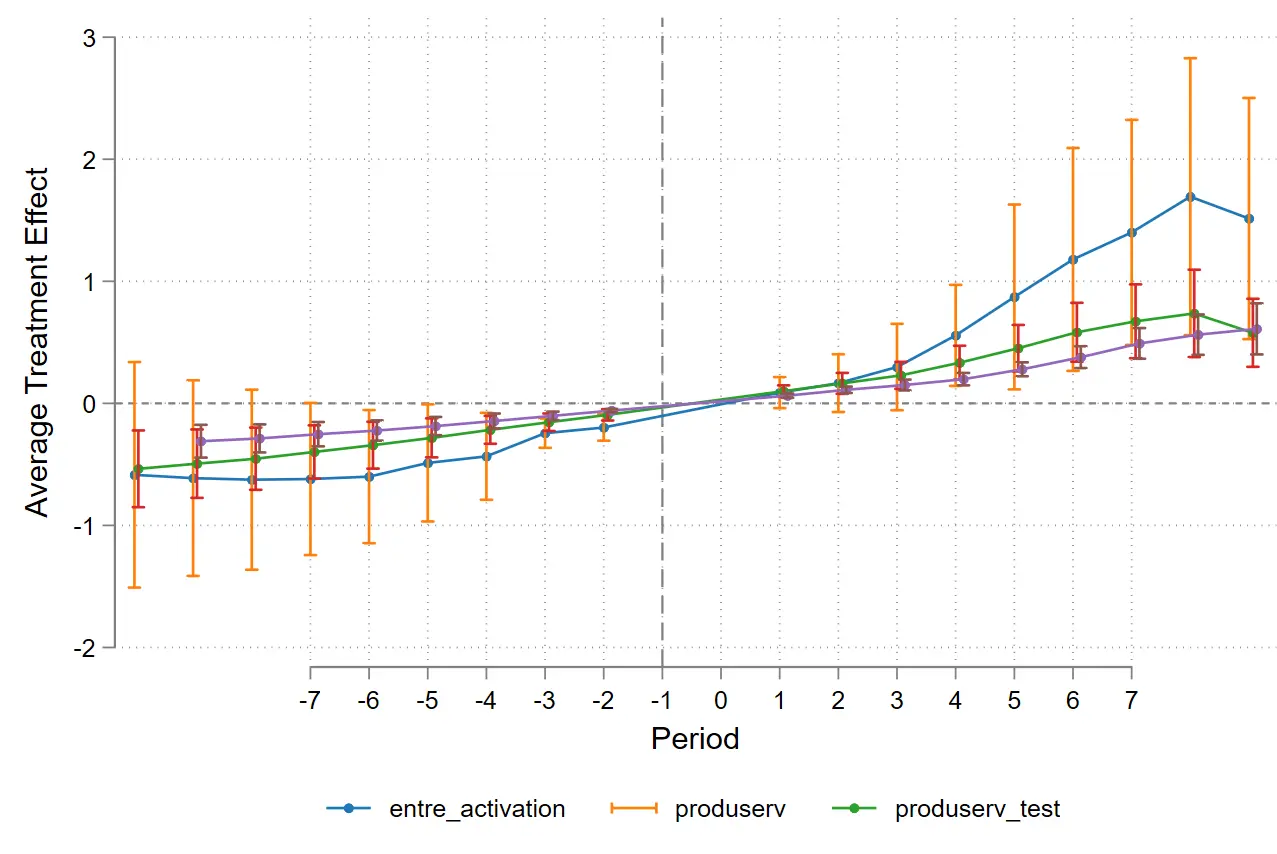
Summary
Econometrics is like this figure: it looks complicated, but the core idea can always be stated in one sentence.
In terms of operation — an event study is just coefficient visualization, but putting the pieces together can vividly show a lot more — heterogeneity, structural comparison, parallel trends, between-group differences, long-run effects…… What matters even more is the design thinking behind the group regression and the analysis of economic meaning.