
ArcGIS: Batch Converting TIF to Excel
 滑翔闪 included in Software Tools and GIS Practice
This post records the detailed steps so I can look them up again later.
Though after speedrunning it, I realized the era seems to have already shifted from ArcMap to Pro……
The great wind of life blows forth the world’s spirit; only the old can see the destruction within……
In Drawing GIS Colored Maps in Stata I introduced the shp-type files commonly used in GIS. In short, GIS’s basic data structure needs three elements: coordinates, a unique identifier, and a measured value. Here I’ll explain how to extract a cross-sectional Excel data file for administrative divisions from an administrative-division map file and a TIF map file.
graph TD;
0(Get map file)==>1(Map main file .Shp);
0(Get map file)==>11(Line main file .Shp);
0(Get map file)==>3(Table file .dbf);
1(Map main file .Shp)==translate==>2(Map outline data);
11(Line main file .Shp)==translate==>9(Map line data);
3(Table file .dbf)==translate==>4(Label file);
5(Data analysis file)==>6(Matching file);
4(Label data)==>6(Matching file); 6(Matching file)==id identifier==>7(Plotting);
2(Map outline data)==id identifier==>7(Plotting);
9(Map line data)==id identifier==>7(Plotting)
| |
A quick guide to GIS
Official tutorial: ArcGIS help
ArcGIS, as commercial software, is actually very easy to pick up. Like Excel, once you understand the layout you can grasp the basic usage.

- As shown, the far left is the file area, for viewing working files.
- To its right is the tool list, with various tool functions to help process data files, so just follow the prompts.
- Further right is layer management.
- The far right is the drawing preview area; drop a GIS file in and you can see the image.
GIS batch processing
From point data to polygon data
Economics data analysis is generally province-, city-, and county-level panel data. GIS files are image files, which can be seen as point-set data, while administrative panels are block-shaped, i.e. polygon data. So our processing approach is to compute the average of the point data within each administrative area, then export.
Partition by the administrative-division shp.
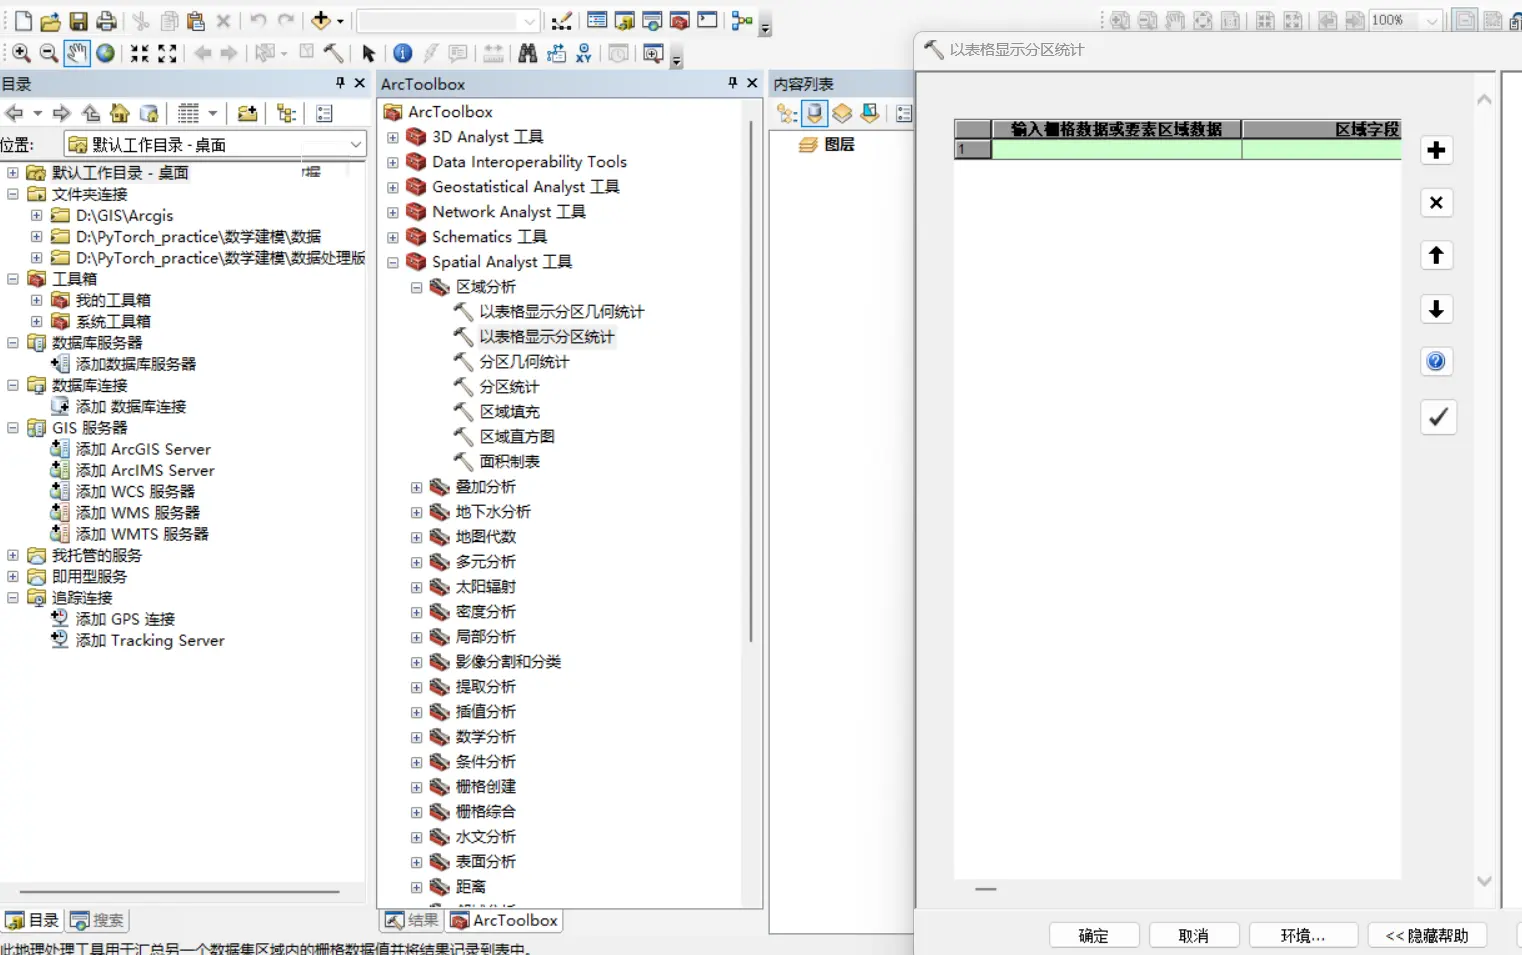
Use the function Spatial Analyst - Zonal - Zonal Statistics as Table to connect the data map with the administrative-division map and compute the mean within each administrative area.
The fake batch processing
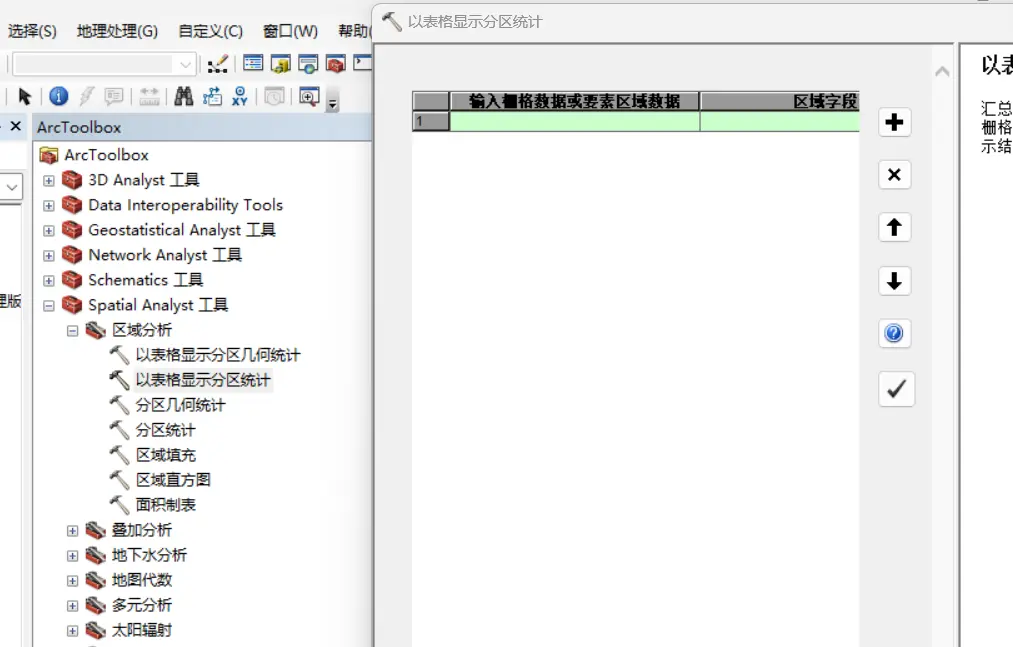
For each method/function, right-click - Batch will pop up an Excel table of custom actions. It seems like you could set your repeated actions via Excel rows to batch-process quickly, but if you actually use it, you’ll find the problem.
After defining n repeated actions this way, only the last-defined action is kept.
The real batch processing
Import the TIF files
Real batch processing means designing a flowchart by hand! Take the TIF data provided in the 2024 Huawei Mathematical Contest in Modeling as an example; put the TIFs in one folder (preferably named in English and with the .tif extension, to make the later connections easier).

Find the shp file
The principle was mentioned earlier — we want to convert the GIS point dataset into administrative-division panel data, for which we need the administrative-division shp map.
There are many resources on GitHub; you can also look in “Drawing GIS Colored Maps in Stata”.
Design the flowchart
ArcGIS’s real batch processing is drawing the flowchart yourself.
Batch-converting TIF to table
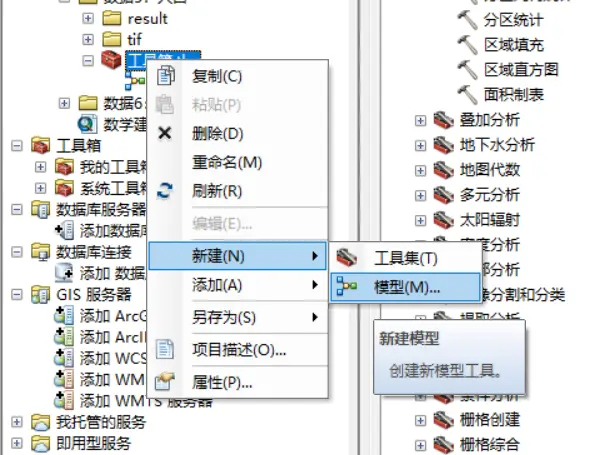
First, right-click under the connected folder and create a new toolbox.
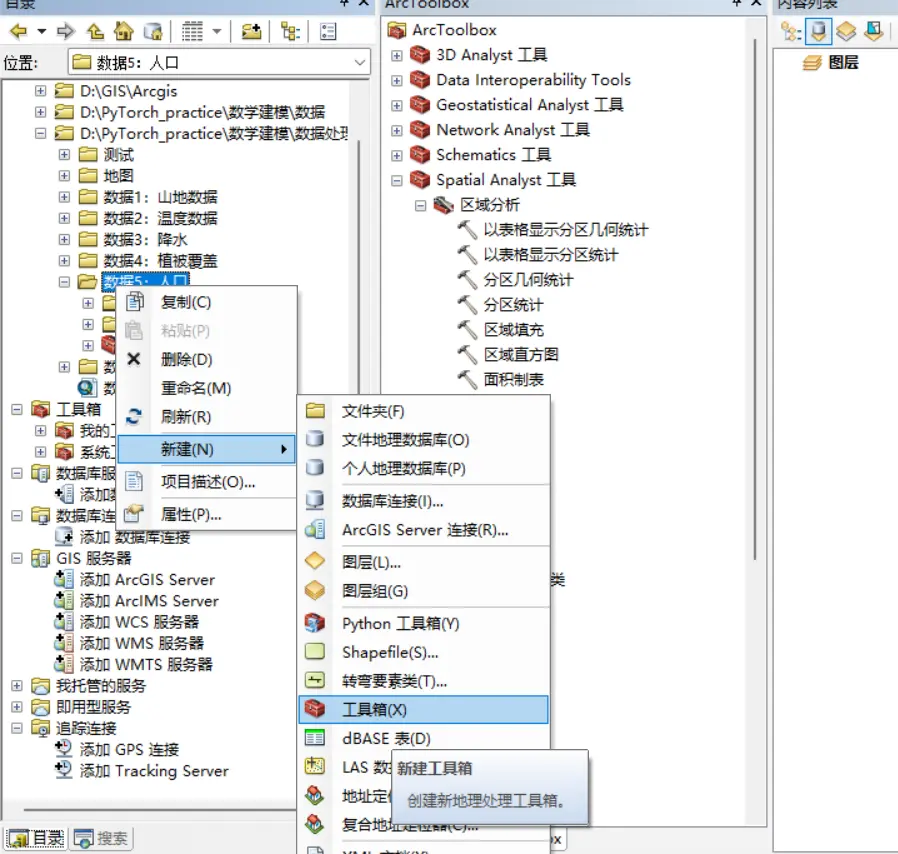
Then right-click under the toolbox to create a new model.
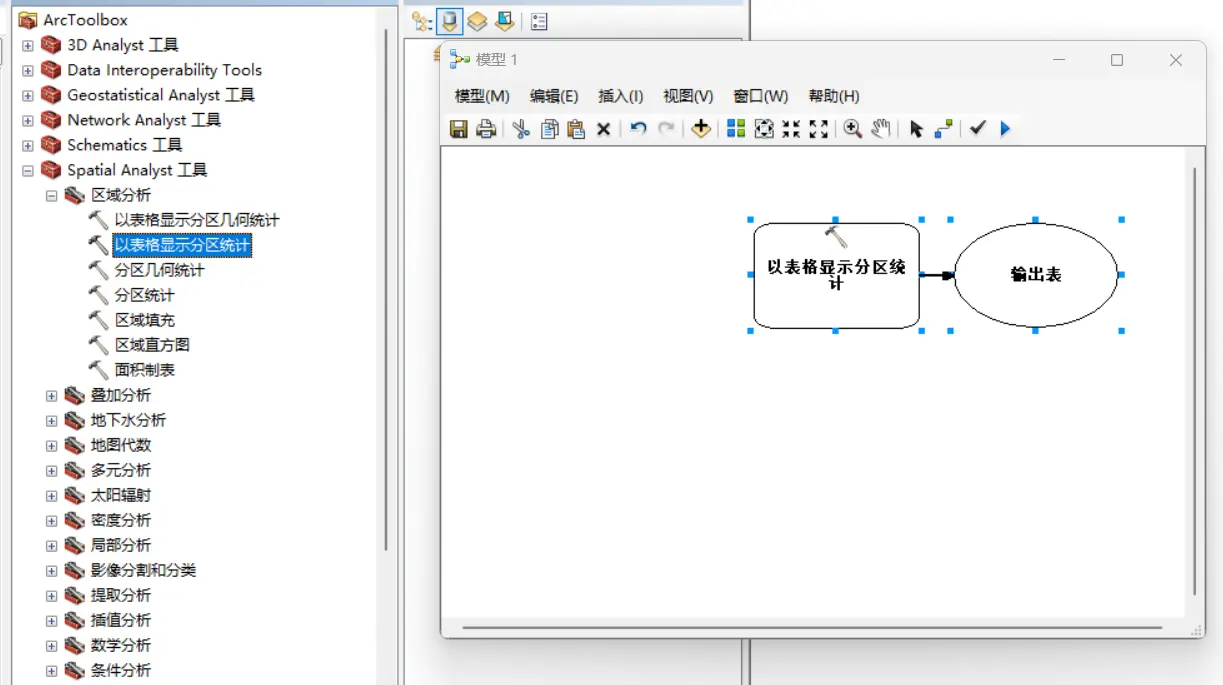
Open the model to edit it, and drag the functions you want from the toolbar.
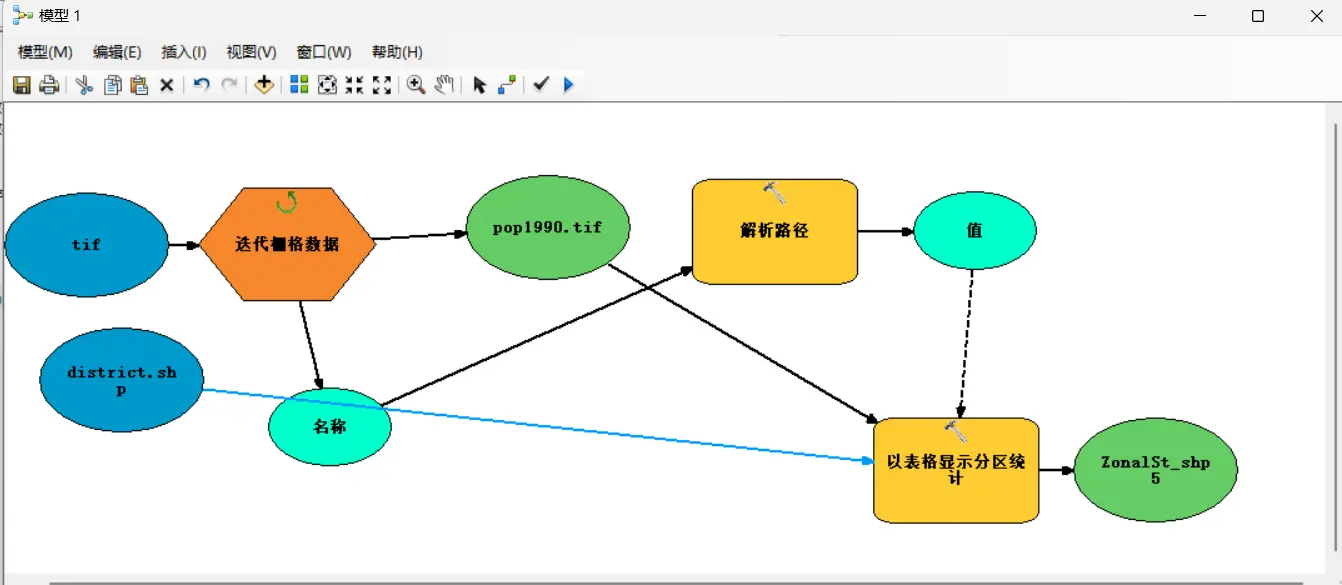
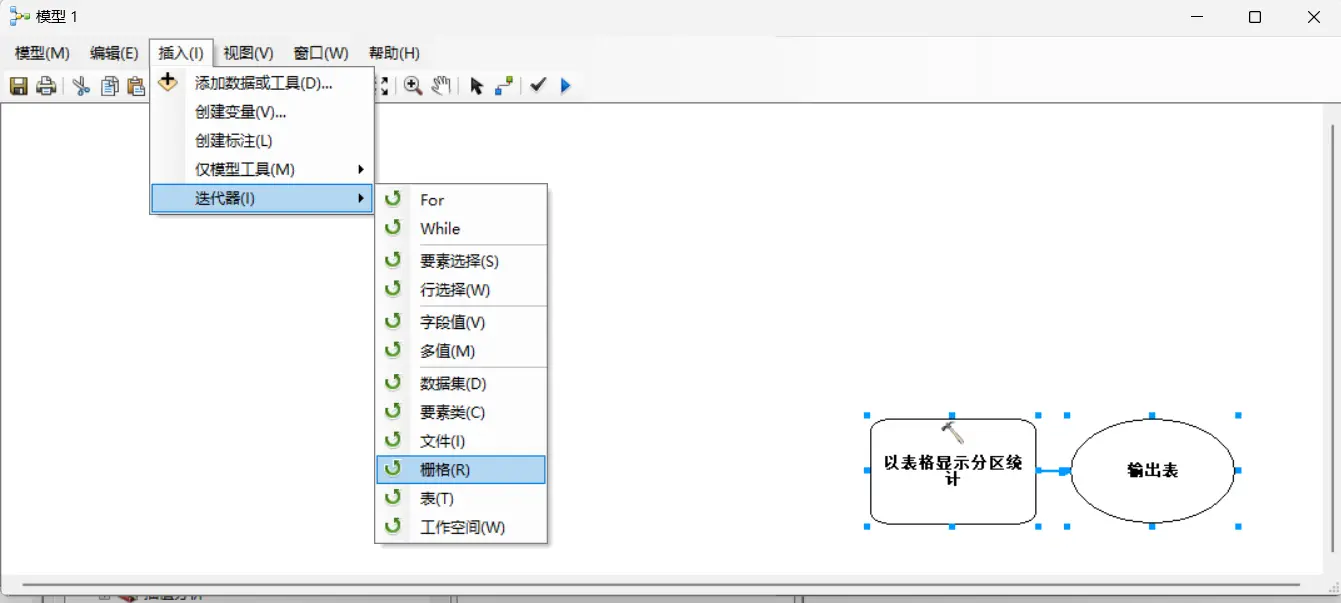
TIF is raster data; Insert - Iterators - Raster
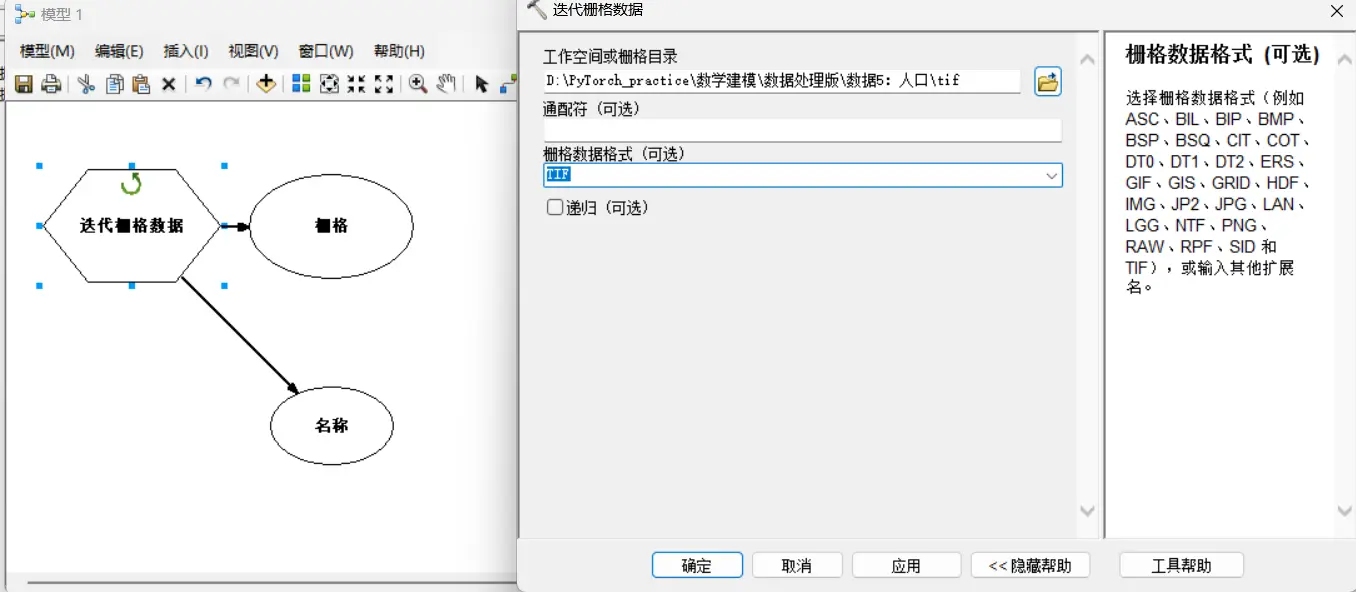
Double-click “Iterate Rasters”. For workspace or raster catalog, choose the tif folder in the data folder; for raster format, choose TIF.
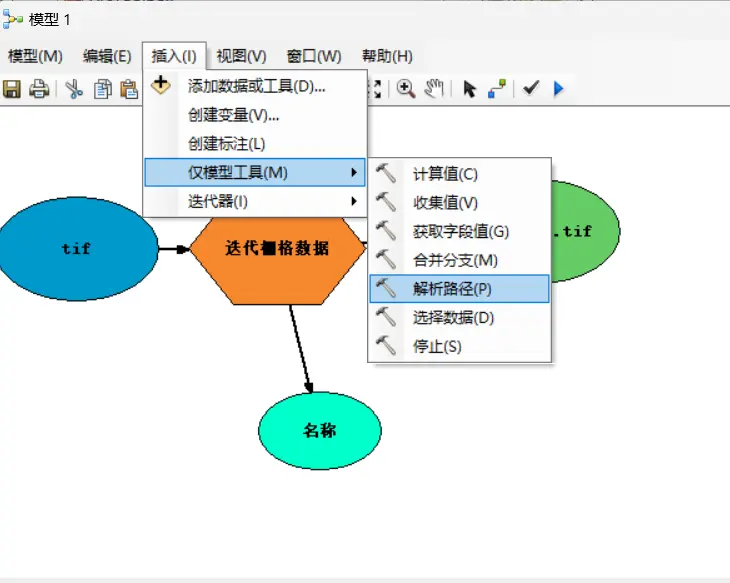
Insert - Model Only Tools - Parse Path
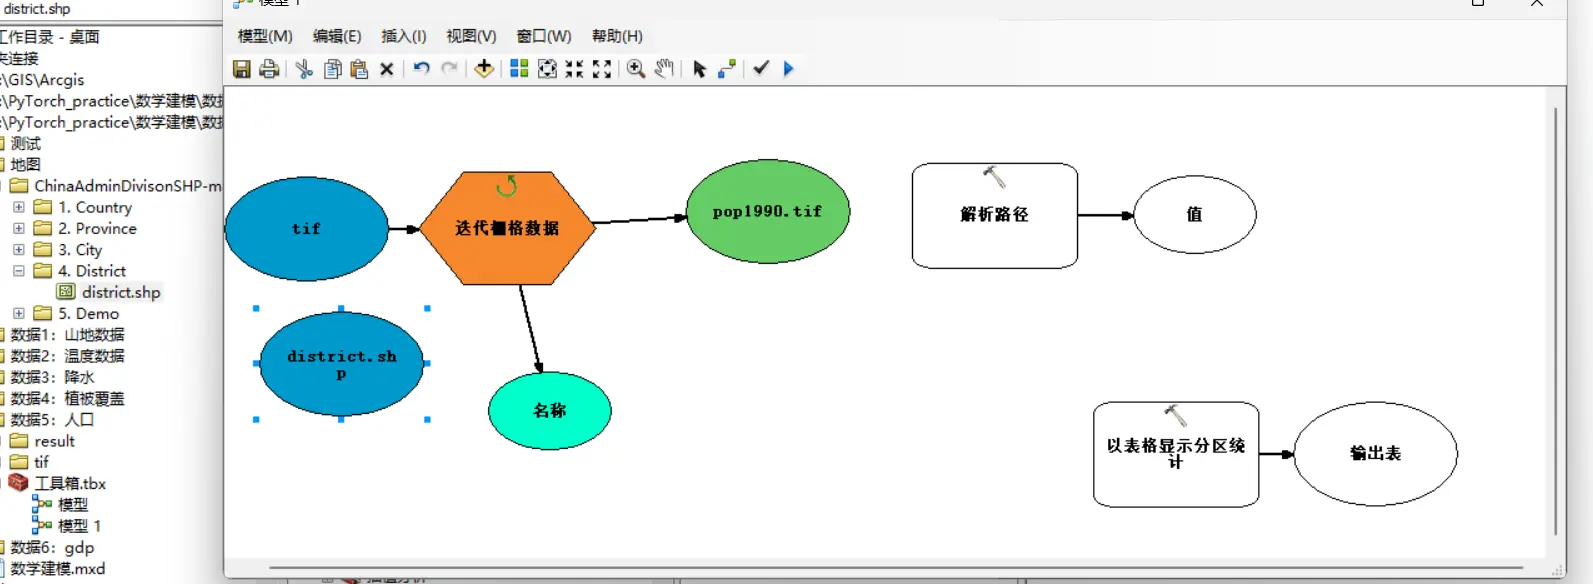
Drag the shp folder you found into the model frame. This post uses the district.shp file of the county-level administrative-division map.
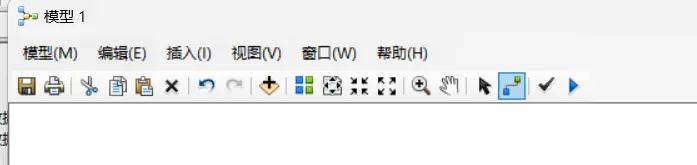
Switch to the connect tool
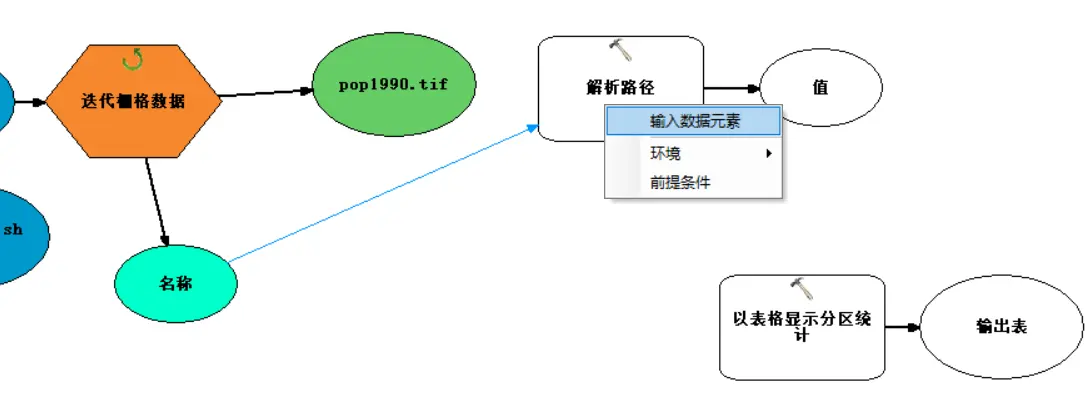
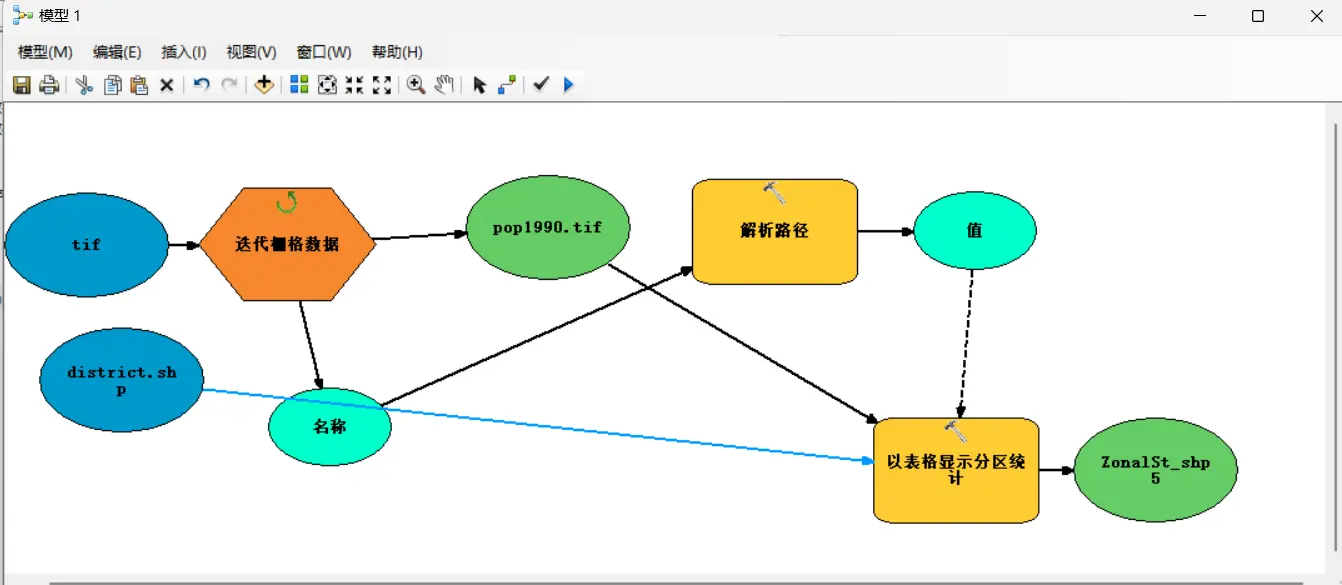
Connect from “Name” to “Parse Path”, choosing “Input data element”.
Double-click “Parse Path”, and choose NAME as the parse type.
So note: it’s best for the tif filenames to be in the form
variable+number, to make the pattern easy to recognize. Best to name all looped files with this kind of structure.
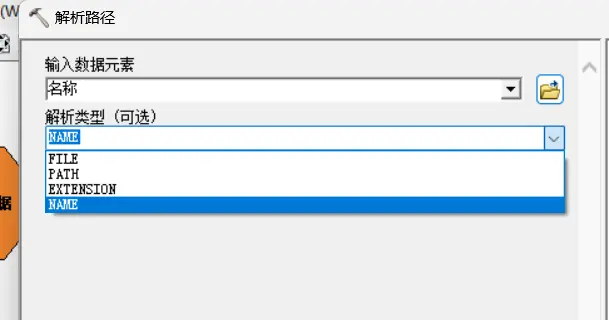
Next is the operation of connecting parameters.
- Connect from “Value” to “Zonal Statistics as Table”, choosing “Environments” - “Output config keyword”.
- Connect from “the first recognized tif data (in this example
pop1990.tif)” to “Zonal Statistics as Table”, choosing “Input value raster”. - Connect from “the first recognized tif data (in this example
pop1990.tif)” to “Zonal Statistics as Table”, choosing “Input value raster”. - Connect from “the shp file (in this example
district.shp)” to “Zonal Statistics as Table”, choosing “Input raster or feature zone data”.
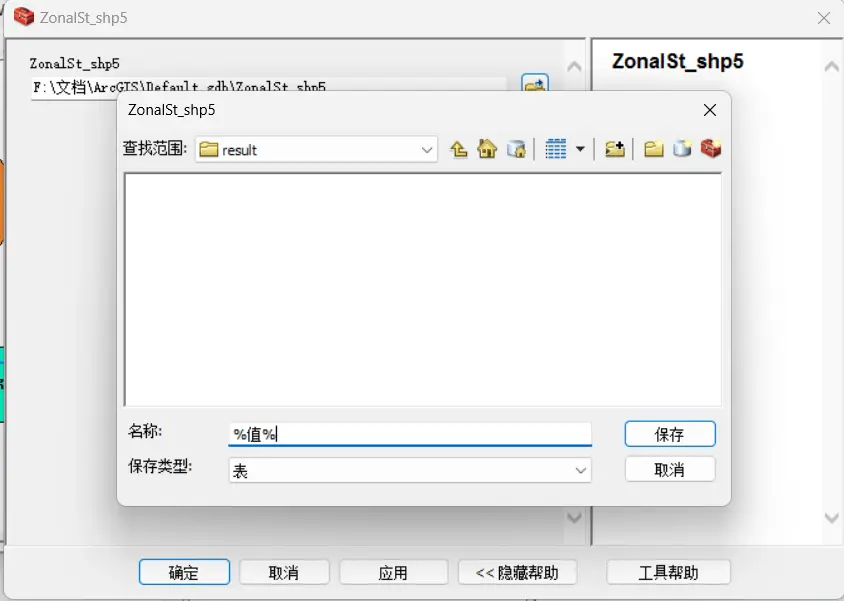
Double-click ZonalSt_shp5. Change “Look in” to the result folder inside the folder (if there isn’t one, you can create one on the fly in the dialog), and change “Name” to %value%.
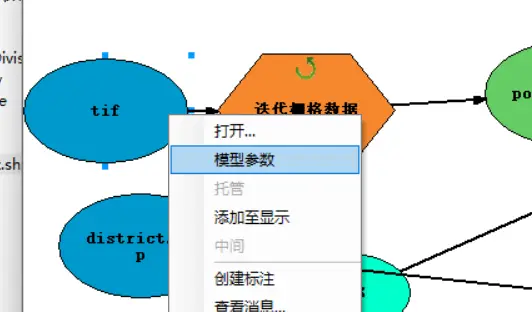
Right-click the tif module and choose Model Parameter.
Don’t forget at this point to switch from connect mode to select mode in the top toolbar, so that right-clicking selects.
Right-click the zone-division module (in this post, district.shp), and choose Model Parameter.
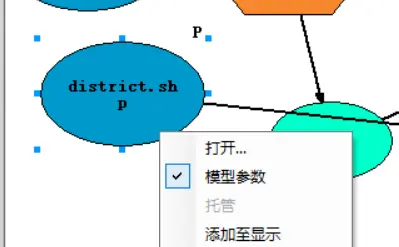
The Auto Layout button at the top can help us tidy up the layout.
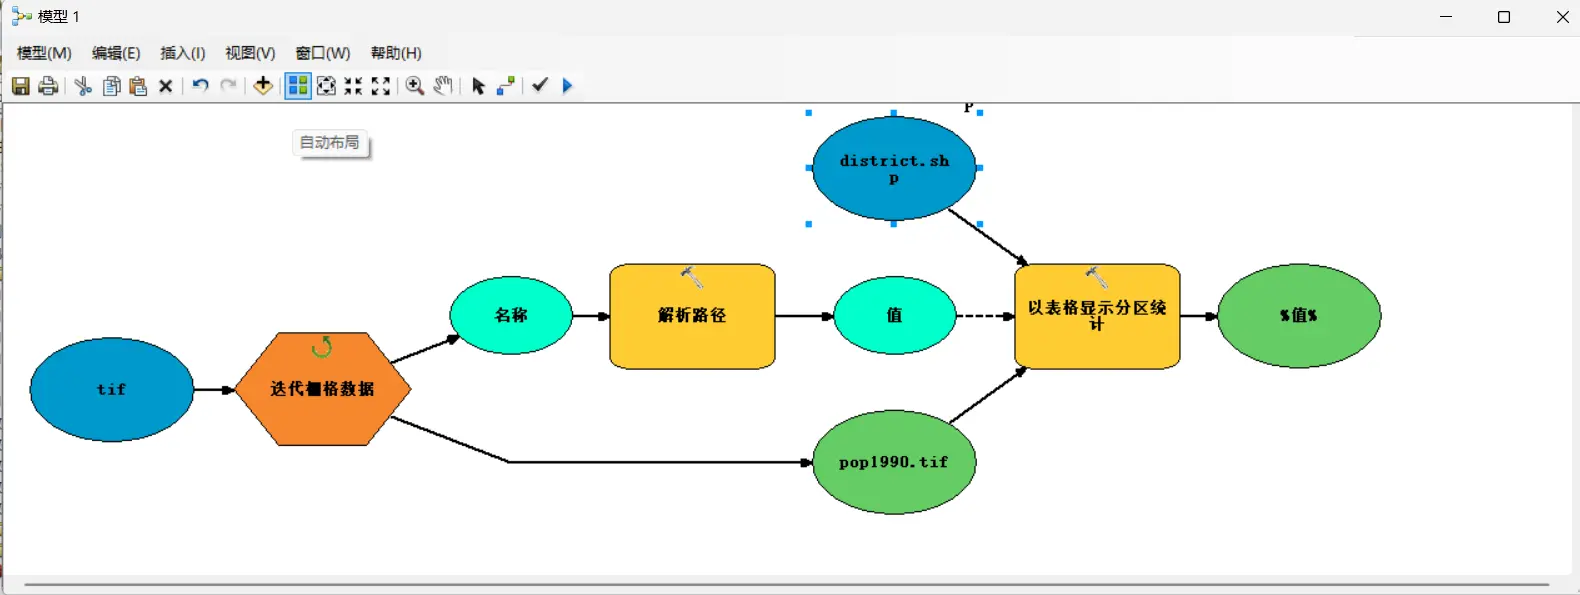
Batch-converting tables to Excel
Continue adding on top of the previous flowchart.
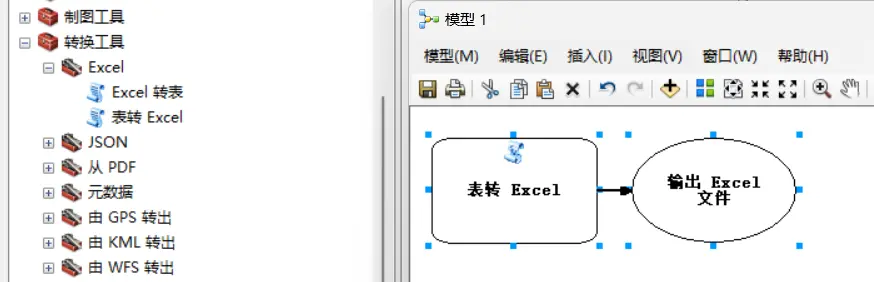
Drag the “Table to Excel” tool from “Toolbox - Conversion Tools - Excel” into the model frame.
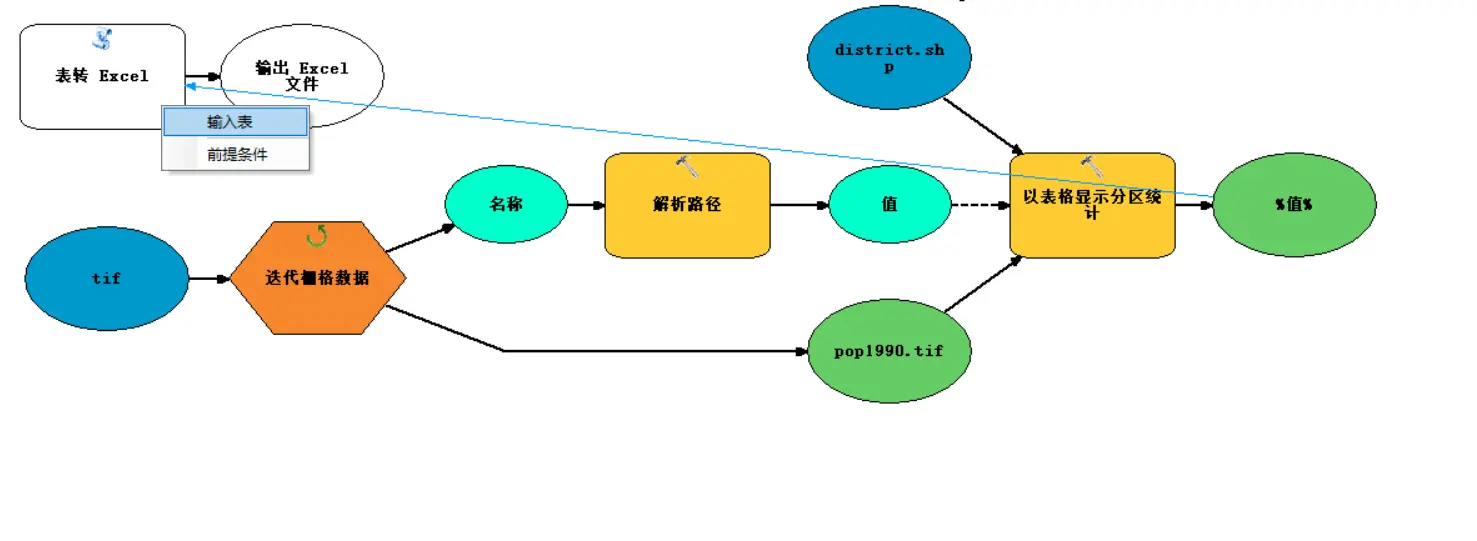
Connect “%value%” to “Table to Excel”, choosing Input table.
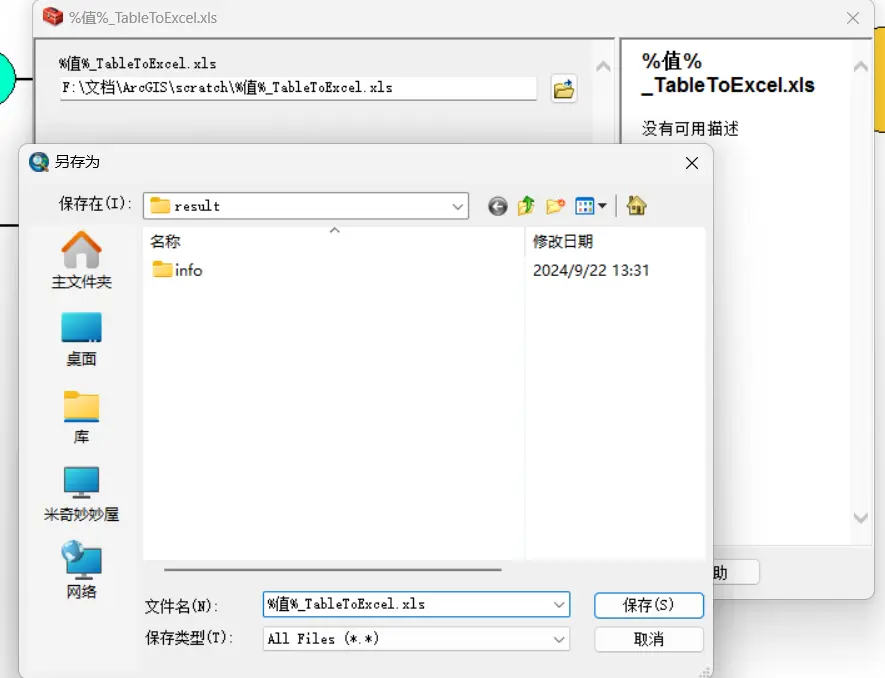
Double-click %value%\_TableToExcel.xls, choose the folder for the save path, and set the filename to %value%\_TableToExcel.xls.
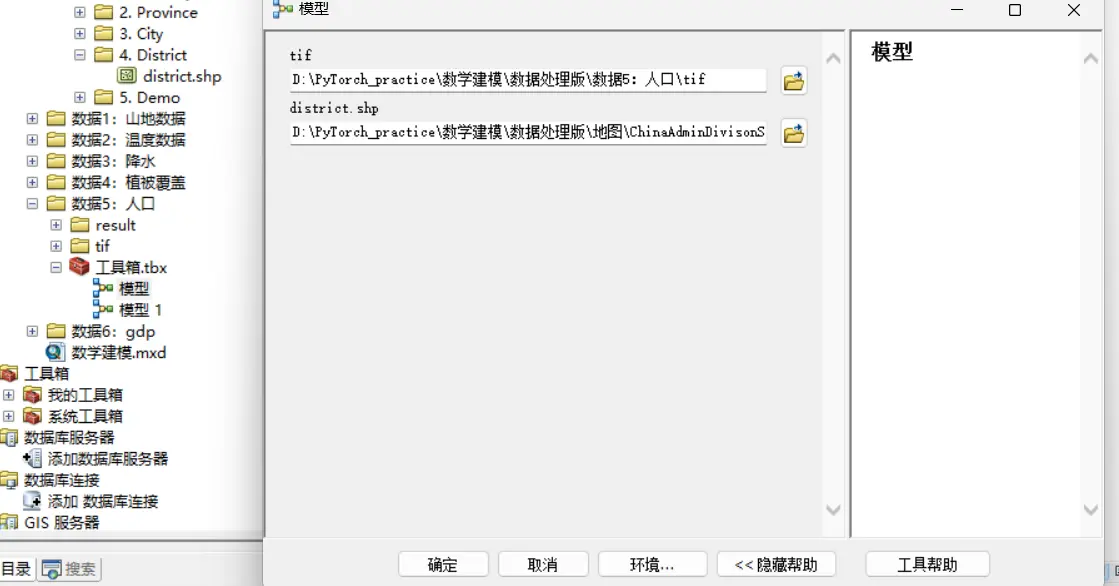
After drawing the flowchart, click the model’s OK to run it.
Other tips
If the operations are all correct, but reading stops partway and says there’s a reading problem, the most likely causes are:
- The GIS file isn’t in
.tifformat. - The folder name is in Chinese.
- The data filenames aren’t structured — for example, both
1990pop.tifandpop1998.tifappear at the same time. - It’s best to keep the Result folder and the tif folder in the same-level directory.