
Explaining the "Trendy Toy Craze": From Network Effects to Multiple Equilibria

“Man is by nature a political animal, but the human heart is not easily fathomed.” — Aristotle
Typical Facts about Pop Mart Products
In Pop Mart’s business conception, the collectible toy economy should first emerge in developed countries.
The economic theory is quite simple:
Consumption is divided into subsistence and developmental; developmental consumption can only be satisfied after subsistence needs are met.
However, the actual situation is—Asian developing countries have responded more rapidly to the collectible toy market than developed countries.
- From a micro perspective, individuals are willing to tighten their belts for the “guzi economy” (collectible toy economy);
- From a macro perspective, current social consumption upgrading is accompanied by declining birth rates1.
Reflected in specific functional relationships, the typical facts about products like Pop Mart are:
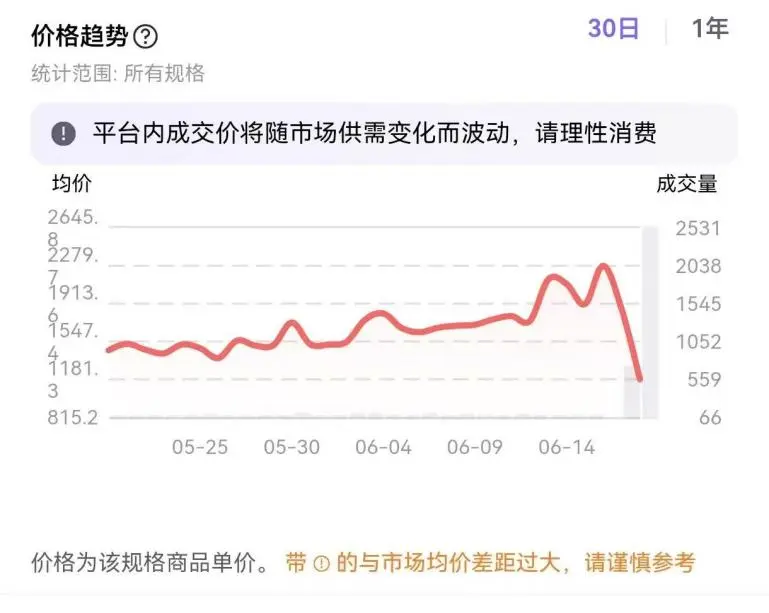
When supply falls short of demand, prices (at least official prices) remain largely unchanged, while Pop Mart’s scalper prices have recently experienced a decline (around July 2025).
This means:
- First, Pop Mart is not a Giffen good2, as its pricing is not cheap, defined as developmental consumption rather than an inferior good.
- It cannot be explained by price stickiness from Keynesian theory, as there is no union involvement here, and menu costs (the costs of changing prices) are low.
- Pop Mart’s official prices often don’t increase much, and its market prices hover near a certain high point, falling into a temporary equilibrium3.
- Pop Mart’s popularity is quite inexplicable; therefore, if Pop Mart launches another product, sales might explode or receive no attention (characteristic of viral products).
Incorporating Conspicuous Consumption into the Model
The viewpoint is simple; here we mainly look at how to incorporate it into economic theoretical models.
Meanwhile, in a 1991 University of Chicago economics class, Nobel laureate Gary S. Becker4 posed a question—why does a famous seafood restaurant he likes, with so many daily customers, never raise its prices?
This phenomenon is widespread—during periods without scalpers (resellers), many successful restaurants, theaters, sports events, and other activities do not raise prices even under sustained excess demand.
Traditional Microeconomic Model
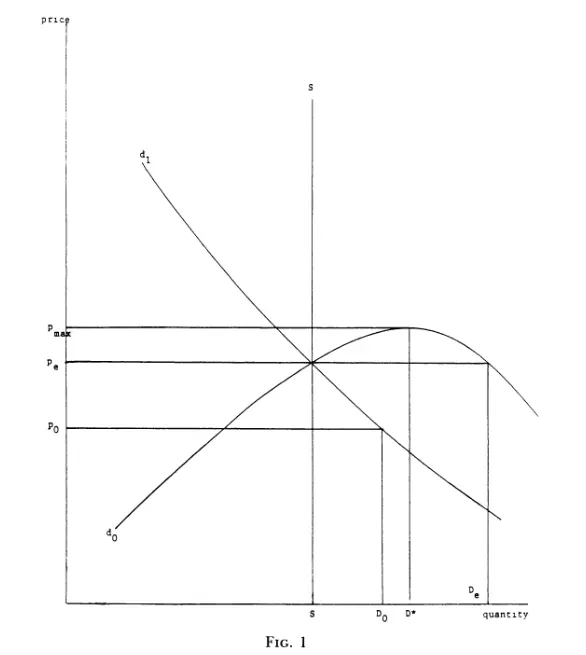
In this price-demand diagram, $d_0$ represents the production function5, $d_1$ represents the demand function. $s$ is the number of seats in the popular restaurant. Currently, the popular restaurant faces demand exceeding supply, corresponding to price level $p_0$. Clearly, when the price increases to $p_e$, the restaurant could earn more. Raising the price to $p_{max}$, profits depend on the elasticity of both sides.
$$ \pi(P)=P\cdot Q(P)-C(Q(P)) $$ $$ \frac{d\pi}{dP}=Q(P)+P\cdot\frac{dQ}{dP}-C^{\prime}(Q)\cdot\frac{dQ}{dP} $$ $C^{\prime}(Q)$ can be written as marginal cost $MC$, while defining price-demand elasticity $\varepsilon\equiv\frac{dQ}{dP}\cdot\frac{P}{Q}$.
$$ \begin{aligned}\frac{d\pi}{dP}&=Q+P\cdot\left(\varepsilon\frac{Q}{P}\right)-MC\cdot\left(\varepsilon\frac{Q}{P}\right)\\&=Q+\varepsilon Q-\varepsilon Q\cdot\frac{MC}{P}\\&=Q\left(1+\varepsilon-\varepsilon\frac{MC}{P}\right).\end{aligned} $$ The first-order condition is the famous:
$$\frac{P-MC}{P}=-\frac{1}{\varepsilon}$$ Consumption elasticity is closely related to firms’ markup space. When examining firms’ market power, we can attempt estimation starting from this equation.
Model with Conspicuous Consumption
When consumers purchase goods, they consider the market for these goods. For example, the value of subsequent posts on Xiaohongshu (Little Red Book), WeChat Moments, and group “screen resonance.” At this point, the demand function becomes:
$$ D=\sum d^{\prime}(p,D)=F(p,D),\quad F_p<0,F_d>0 $$
- Recursive structure—total market demand D is the sum of individual demands d, while each individual’s demand function considers total market demand D.
- The total market demand function still shows less demand at higher prices ($F_p<0$).
- The market also has a positive feedback structure: the more people buy, the more are attracted ($F_D>0$) (network effect).
Next, we differentiate the total demand function:
$$L(p,D)=F(p,D)-D=0$$ $$ dL=L_pdp+L_DdD=0 $$ At this point,
$$ L_p=F_p,\quad L_D=F_D-1 $$
Finally, we obtain:
$$ F_pdp+(F_D-1)dD=0 $$
Transforming, we get the rate of price change with respect to demand6:
$$ \frac{dp}{dD}=G_D=\frac{1-F_D}{F_p} $$ Here, $G_d$ represents the derivative of the inverse demand function with respect to demand d.
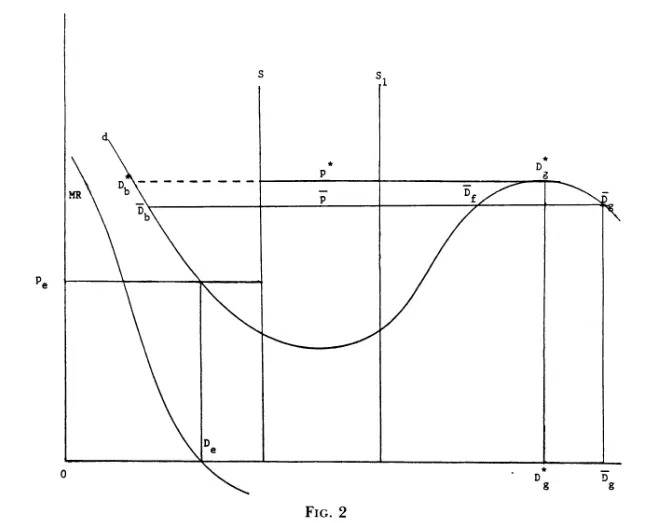
If the social effect is strong enough—$F_D>1$—then $\frac{1-F_D}{F_p}>0$. From the rate of change perspective—price increases as demand increases. Until the firm reaches the third-stage inflection point of production $p_{max}$ (compatible with traditional explanation, which is Figure 3’s content).
But now, based on the network model, there’s a new possibility—
When total demand is low, $F_D<1$; when total demand is high, $F_D>1$.
At this point, the total social demand function is no longer a monotonically declining line but a curve that first declines then rises.
Assuming fixed costs,
$$ \begin{aligned} MR&=\frac{d(PD-C)}{dD}\\ &=P+D\frac{dP}{dD}\\ &=P+D(\frac{1-F_D}{F_p}) \end{aligned} $$ Since in the low-demand stage $\frac{dp}{dD}=G_D=\frac{1-F_D}{F_p}<0$, this results in a downward-sloping curve.
Actually, the height and slope of the MR curve relative to the D(P) demand curve can be compared as follows:
Height (evident from the MR equation): $$ MR-D(P)=D(\frac{1-F_D}{F_p}) $$ Therefore, initially the MR curve lies below the demand curve.
This represents the multiple equilibria in reality! For example, pricing at $p^*$.
- If the product becomes an instant hit, with word-of-mouth spreading, then market demand accumulates to the $D_g^*$ level.
- If the product receives little attention, actual demand remains at the $D_b^*$ level.
Given this uncertainty, firms generally dislike overproduction ($s-D_b^*$). Therefore, firms tend to choose the equilibrium level where $MR=0$.
Significance of the Model
- This model explains why advertising and marketing are so important in real-world store experience (this is natural).
- The least obvious point is—why viral firms maintain conservative pricing during hot sales periods. The essence lies in uncertainty brought by network effects.
- The model elegantly depicts why equilibrium during the popular phase is so brief—price function adjustment space is limited—when network effects continue to weaken, prices automatically decline.
- Currently, there remains exploration space for variables characterizing network effects.
Stepping Back to Understand Network Effects
Individual utility is:
$$ U_i=U(x_i,y_i;X) $$
where $X=\sum x_{j}$ represents network effects.
Next, we solve for marginal conditions:
$$ MU_{x_i}=\frac{\partial U}{\partial x_i}+\frac{\partial U}{\partial X}\cdot\frac{\partial X}{\partial x_i} $$ If $\frac{\partial U}{\partial X}$ is large, it signifies a positive externality: when consumers purchase viral products, the additional satisfaction from social attributes may even exceed the negative utility from price increases.
From Network Effects to Complexity Economics
Network effects are similar to multiple structures of positive and negative feedback.
Great principles never use narrow concepts.
Regional economics, spatial autocorrelation is also a type of network effect. Distance and orientation in regional economics have never been “narrow”—cultural distance (e.g., dialect regions), economic distance (industrial structure), cognitive distance (e.g., industrial structure competition or complementarity, patent similarity)………
Just like the multiplier effect in Keynesian theory. Actually, Keynes also had the concept of multiple equilibria. An economy, under certain conditions, may have multiple equilibria.
Due to incomplete adjustment of interest rates, prices, and wages, society has a self-reinforcing effect. People’s sentiments alternate between optimism and pessimism and infect each other, which is what Keynes called “animal spirits.” Precisely because of this, adjustment of social expectations and regulation of economic signals are so important.
This is why Keynes7 said:
“In the short run, people’s psychological expectations and confidence (animal spirits) are more important than gold reserves.”
Economics today has moved toward complexity economics. Complexity economists emphasize network effects, heterogeneous agents, multiple equilibria in society. Actually, the explanation of network effects is also simple: I follow the rise and fall of social voices, but how to extract social voices and incorporate them into analysis? This is one of the most worthwhile issues to explore.
-
Too many macroeconomic explanations: caused by gender division of labor, social security, culture, parenting pressure, housing prices…… One macroeconomic explanation might refer to another blog post 《The Origin of Wealth》: A Thousand Years of Darkness, One Lamp Illuminates. ↩︎
-
Under special circumstances, inferior goods show price and demand moving in the same direction, e.g., potatoes during famine (the textbook’s perennial example), where higher prices lead to more purchases. ↩︎
-
Many call this financial manipulation to harvest “韭菜” (retail investors). ↩︎
-
This Nobel laureate enjoys modeling various economic phenomena, with labor economics research predominating. ↩︎
-
Three-stage production function, so firms only produce in the second stage. The process involves comparing marginal product (mp) and average product (ap). ↩︎
-
Actually, elasticity can also be seen as dimensionless rate of change. ↩︎
-
The General Theory of Employment, Interest and Money (1936) ↩︎