
LDA Topic Modeling and Gephi Visualization

Recently, many economics papers have employed LDA topic modeling1 and social network analysis. Here, I attempt to visualize blog topic keywords using this methodology. The workflow is as follows:
- Python reads markdown documents.
- Cleans and tokenizes text.
- Builds LDA topics.
- Constructs network data.
- Visualizes using Gephi.
LDA Topic Modeling
LDA is an established technique in computational text analysis, yet it remains simple and effective, serving as an unsupervised machine learning method. For economics, it suffices to understand that it summarizes the number of topic keywords in a text. In top-tier journal articles, it is often used to measure data types2.
Examples of applications in research papers:
- JPE 2025’s “More Laws, More Growth? Evidence from US States” quantifies the distribution of new legislative topics across U.S. states, examining the relationship between legislation and economic growth. Legislation related to business environment topics proves more effective, with the mechanism being investment attraction and reduced economic uncertainty.
- RES 2025’s “Women in the Courtroom: Technology and Justice” uses panel data from live courtroom broadcasting pilot cases to study female case success rates, where case types are summarized into 50 topic categories based on legal content.
- For other text analysis references, see “Xiangzhang Article 3057: How to Use Text Analysis Algorithms in Economics?”
For understanding LDA, I recommend a concise and intuitive YouTube video (requires VPN access):
Gephi
Examples
Gephi is a network relationship visualization software. I was first introduced to this software by my blogger friend Song. He used this software in his thesis to study the Global Lithium Product Trade Dependency Network.
For foundational knowledge of network analysis, I highly recommend the open-source Iris Flower statistics textbook “The Way of Data.”
The most classic example of social networks is Six Degrees of Separation—through six key individuals, one can connect with anyone in the world. This theory manifests in network analysis as (shortest) paths and network connectivity.
The most classic dataset for social network analysis is the Karate Club. The karate club had two instructors who eventually parted ways. A statistician had previously recorded interpersonal relationships within the club, and after social network visualization and clustering, the resulting division closely matched the actual split.
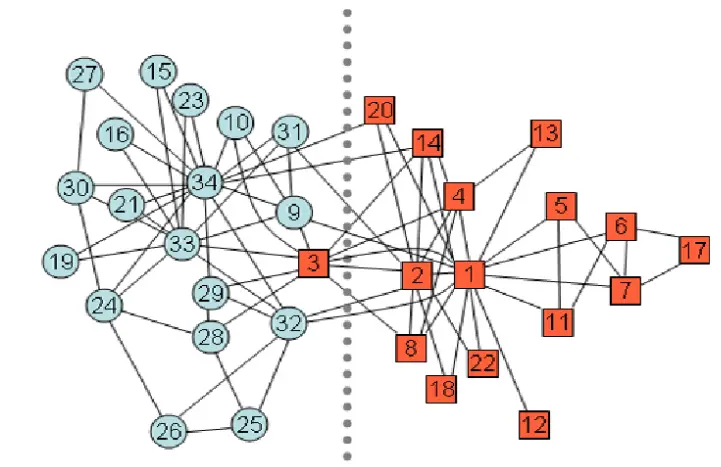
Social network visualization primarily involves network evolution (clustering, fragmentation), distribution3 (key nodes, weights, density, structure4), and prediction.
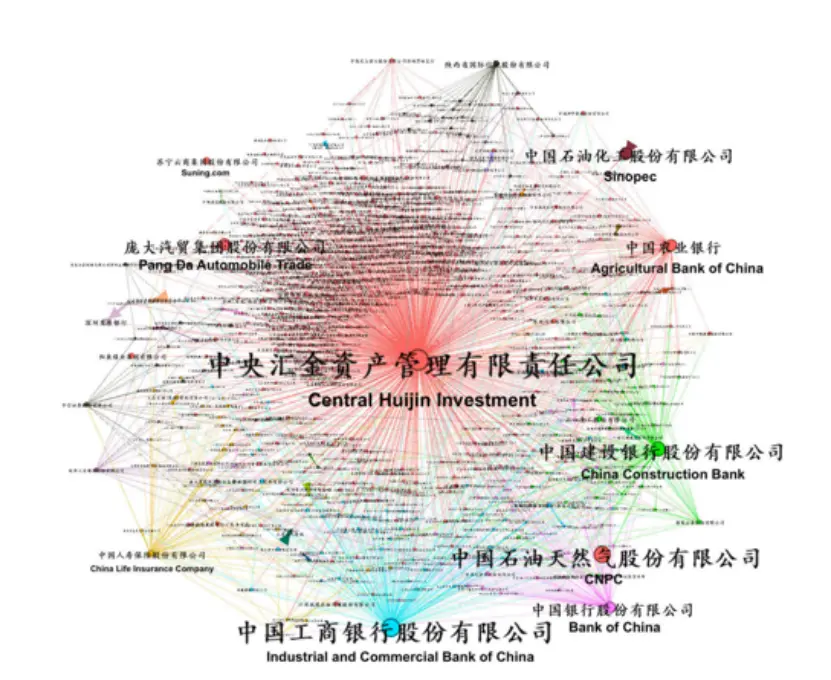
The paper “Ownership Networks and Firm Growth: What Do Forty Million Companies Tell Us About the Chinese Economy?” studies the distribution and evolution of China’s equity networks.
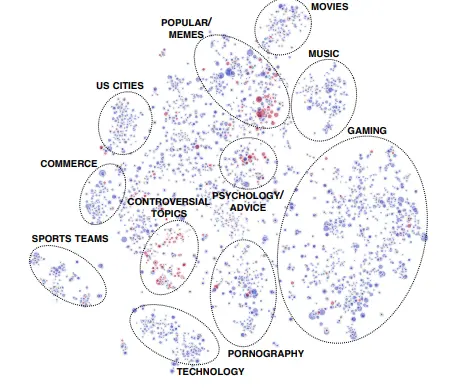
The paper “Community Interaction and Conflict on the Web” examines Reddit community networks: less than 1% of communities initiated 74% of negative mobilization behaviors. These conflicts are typically started by core members of active communities, while the actual participants are less active peripheral members.
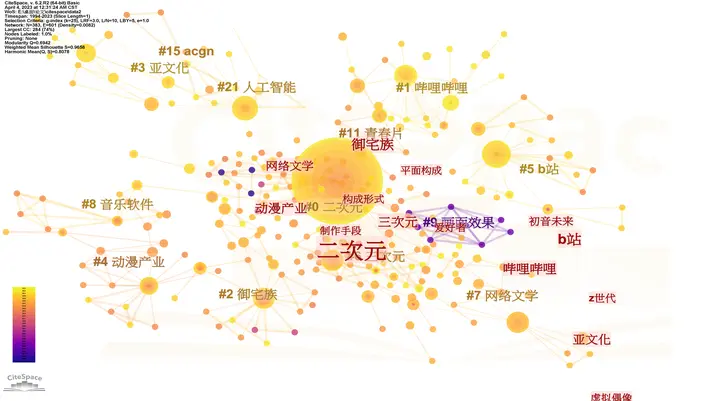
Literature review software like Citespace also constitutes a form of network analysis, specifically knowledge graphs. See another blog post “Citespace Literature Visualization.”
Previously tested images.
Analysis Software
Summarized by GPT regarding available social network analysis software options.
| Tool | Positioning | Advantages | Disadvantages | Suitable Scenarios |
|---|---|---|---|---|
| Gephi | Network Visualization + Exploration | User-friendly interface; rich layout algorithms; community detection features | Visualization-focused; not suitable for ultra-large networks | Rapid visualization, presentations, exploration |
| Cytoscape | Originally for biological networks → General-purpose | Rich plugin ecosystem; commonly used in research; tight integration of analysis and visualization | Limited performance with large-scale data; slightly complex interface | Bioinformatics, scientific network analysis |
| Pajek | Classic social network analysis software | Can handle million-scale networks; common in academia | Outdated interface; steep learning curve | Large-scale social network research |
| NodeXL | Excel plugin (Microsoft ecosystem) | Quick to learn; convenient for social media data scraping | Limited features; full version requires commercial license | Social media network analysis for beginners |
| Python | NetworkX / igraph programming tools | Flexible; customizable; can integrate with machine learning and text mining | No visualization interface; requires coding | Highly flexible, research experiments |
Code
Three folders:
- Blog markdown folder (original blog
.mdfiles) - Tokenization folder (txt documents with one word per line, e.g., 了, 的, 得, 地, 他, 她, 滑翔闪…)
- Results folder
I used jieba for tokenization and gensim.models for model training. For further optimization, modifications can be made at these stages5.
Note the version compatibility issues between
gensimandnumpy.
|
|
After using the code to generate the graph file gephi_topic_term.gexf,
- Open Gephi: File → Open → Select .gexf file
- Use Layout (e.g., ForceAtlas2) for arrangement
- Color/filter based on node attribute “type”
- Adjust node size based on degree/weight
If you’ve used Citespace, you’ll find Gephi’s beautification operations familiar6. Personally, I feel this type of visualization primarily serves to intuitively present clustering structures, but in practice, large datasets struggle with force-directed graph visualization. The focus of social network analysis lies in capturing and measuring special structures and important nodes.
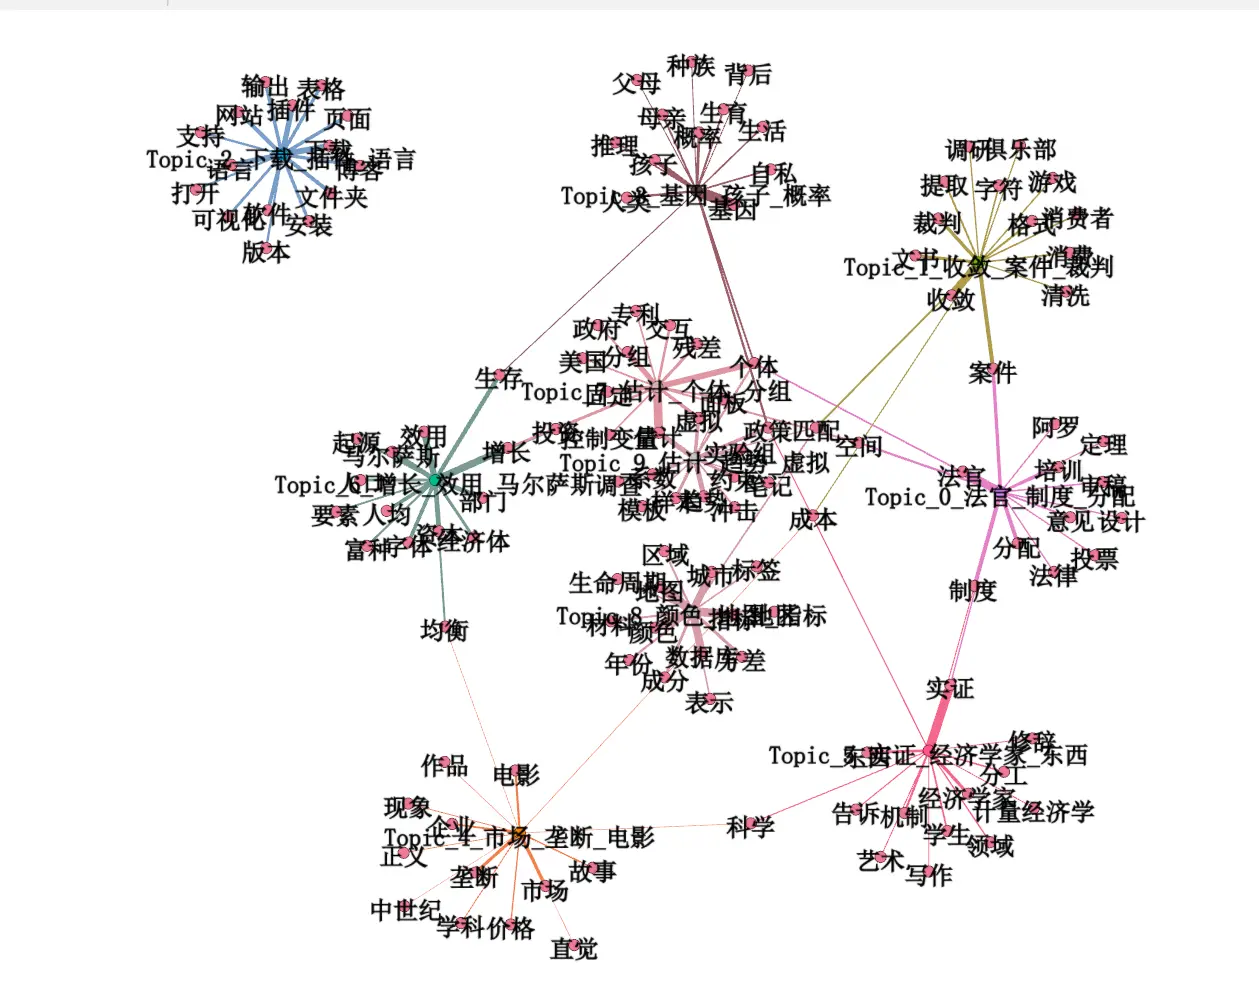
After using LDA to generate topics and words, the visualization results are as follows:
It appears my blog revolves around economics, branching out to software and sub-disciplines. Movie reviews and other software topics are indeed isolated at the farthest edges.
The following image results from optimized code using jieba to further remove adverbs and adjectives. Personally, I feel this type of image summary is quite effective.
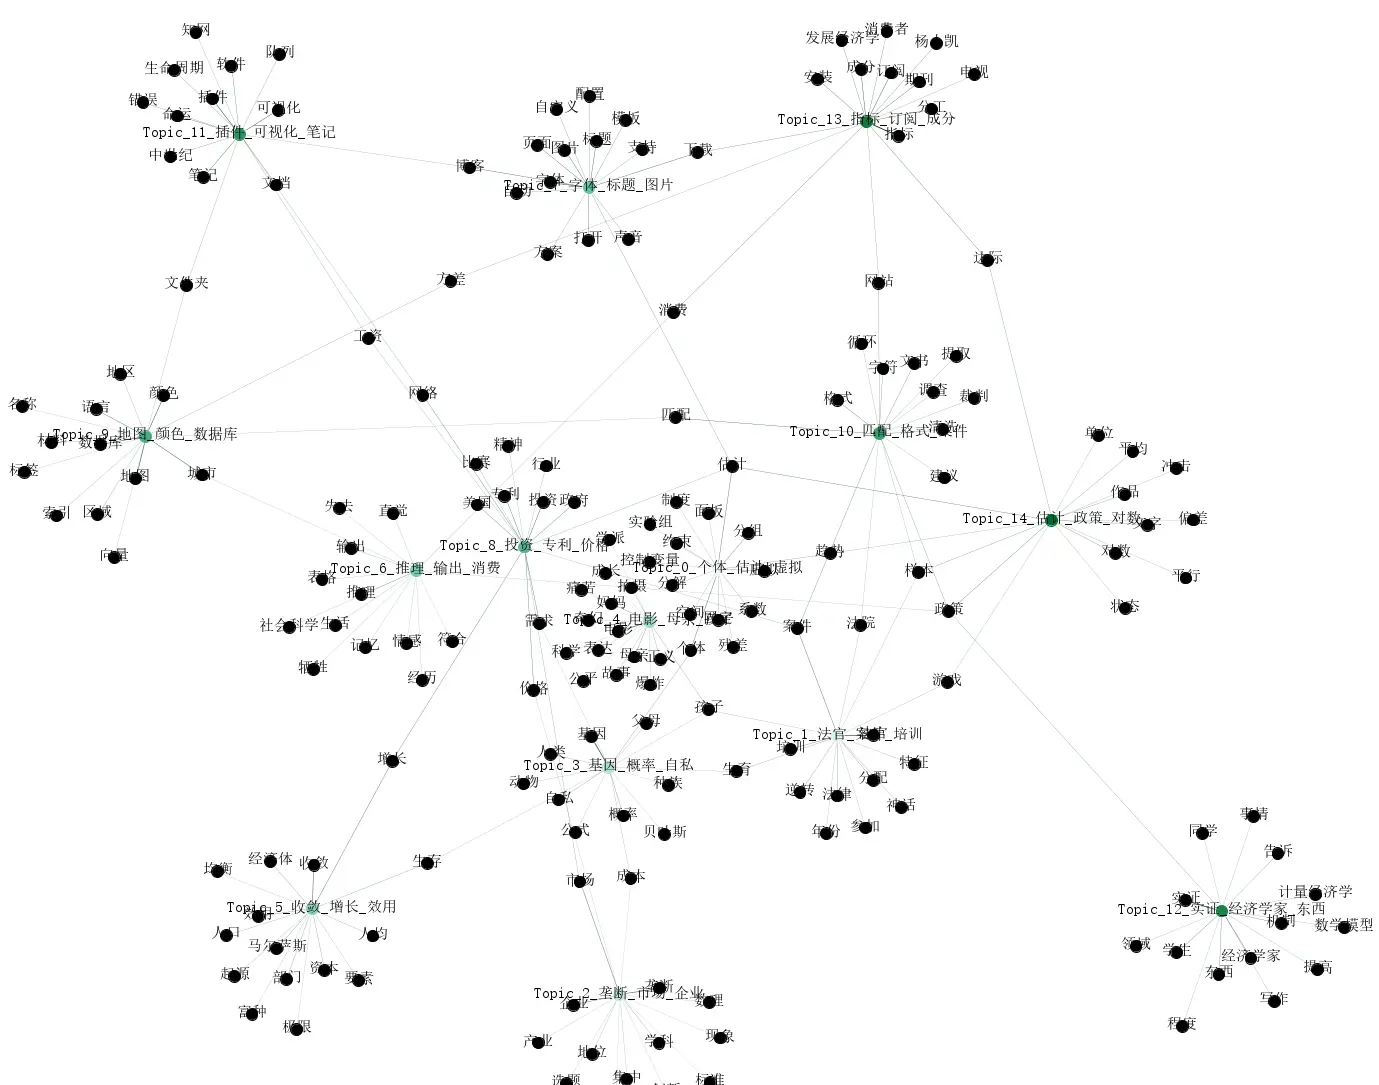
Optimized code (my personal laptop couldn’t handle it, so I bought a cheap cloud server to run it).
|
|
Some Reflections
I often criticize machine learning as a black box, but for someone like me who uses various analysis software, how different are many software methods from black boxes? If a Stata external command has an error, without deep understanding or theoretical cross-validation from multiple perspectives, it’s difficult to detect the mistake.
For example, “Stata” bdiff+reghdfe correct usage, many papers have been misled. I recall a previous did external command also had errors.
I believe AI will enhance positive feedback in code-based learning, but simultaneously, AI also brings the illusion of “I understand.” As Feynman consistently emphasized—knowing and understanding are not the same7. Running code and understanding code are far from the same level of learning. In the era of AI learning knowledge illusions, what truly constitutes understanding? Perhaps this needs to be reconsidered.
-
Although LDA is an old method, economics excels at repurposing established techniques. ↩︎
-
In recent years, the exploration of heterogeneous agents has become increasingly important ↩︎
-
Descriptive statistics alone can be sufficiently eye-catching. ↩︎
-
Viewing the universe as a network space, recent research suggests Earth may reside within a cosmic void. After reading a Zhihu answer about interstellar travel (Can humans truly never leave the Laniakea Supercluster?), I no longer believe in extraterrestrials on Earth 😢. ↩︎
-
With AI, data analysis isn’t difficult; the challenge lies in obtaining suitable materials. ↩︎
-
However, with large datasets, beautification calculations for dispersed distributions become too complex and are rarely used. ↩︎
-
Hence Feynman’s criticism that social sciences might be pseudoscience. ↩︎