When writing economic empirical papers, it is common to output a large number of tables (mainly descriptive statistics and regression results). Mastering instant table output techniques is like casting spells without incantations!
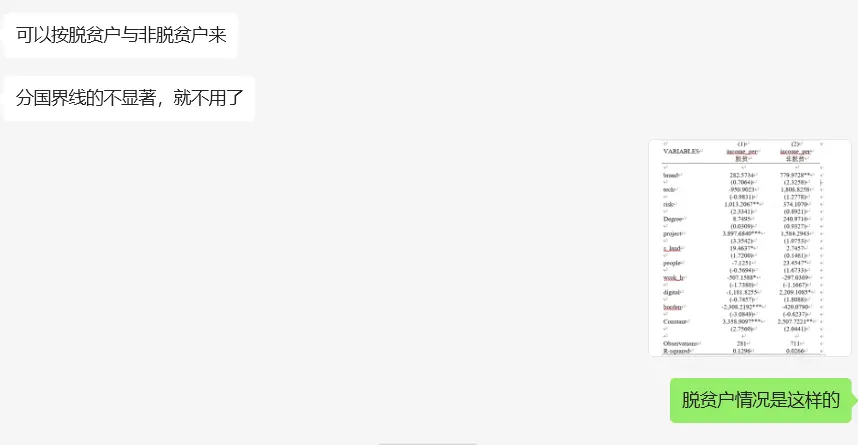
When discussing variable selection with others, responding instantly feels just like this!
Currently, Stata has a plethora of corresponding commands—asdoc, outreg2, logout, estout. Here’s a brief summary of where each command is commonly used and its characteristics.
Estout: Versatile, LaTeX Output
estout is written by Professor Ben Jann from the University of Bern, Institute of Sociology. (The coefplot command was also developed by this expert).
It excels in customization, making it a mainstream command for result outputs. Its most powerful feature is support for LaTeX export .
Asdoc: Descriptive Statistics
Add asdoc to your operations to save the corresponding file.
The downside is that regression table customization is poor and does not meet the general journal requirements. It is generally used only to display descriptive statistics.
tabout supports powerful descriptive statistics custom tables. For the latest installation, see: [https://tabout.net.au/docs/home.php^1 ]
1
2
3
4
ssc install asdoc , replace // Download command
sysuse "auto.dta" , clear // Use Stata ’ s built - in sample data
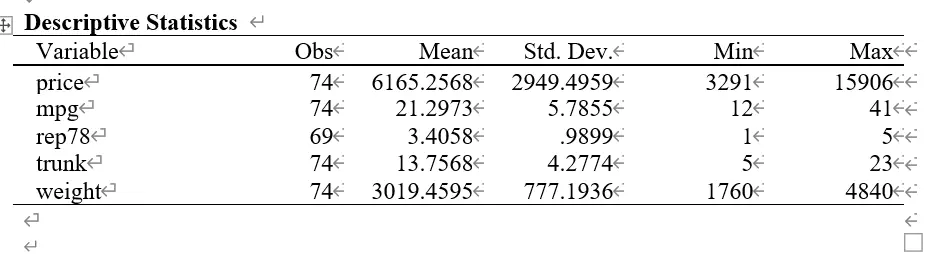
asdoc sum price mpg rep78 trunk weight , dec ( 4 ) save ( Table1_Descriptive_Statistics1 . doc ) title ( "Table 1 Descriptive Statistics 1" )
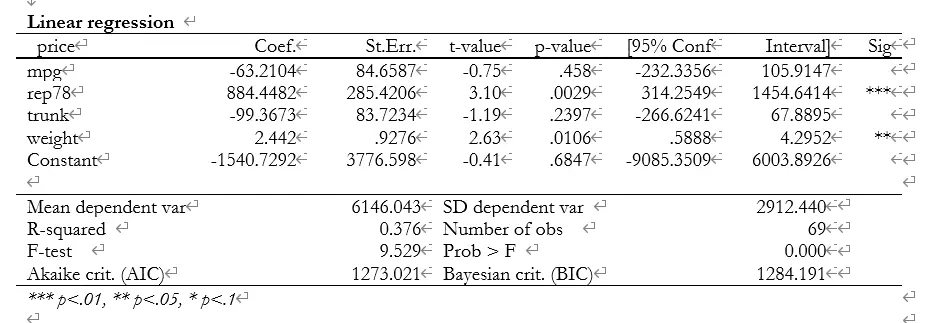
asdoc reg price mpg rep78 trunk weight , robust , save ( Table2_Basic_Regression . doc ) title ( "Table 2 Basic Regression" )
asdoc descriptive statistics
asdoc regression statistics
Logout: Mean Difference and Correlation Coefficient Tests
logout stands out by being able to output mean difference tests and correlation coefficient tests in addition to descriptive statistics and regression results1 .
 1
 2
 3
 4
 5
 6
 7
 8
 9
10
11
12
13
14
15
16
17
18
19
20
ssc install logout // Download command
************ Descriptive Statistics *****************
sysuse "auto.dta" , clear // Use Stata ’ s built - in sample data
// Output to Word ( RTF format )
logout , save ( Filename ) word replace : ///
tabstat price wei len mpg rep78 , ///
stats ( mean sd min p50 max ) c ( s ) f ( % 6 . 2 f )
// Output to Excel ( XML format )
logout , save ( Filename ) excel replace : ///
tabstat price wei len mpg rep78 , ///
************ Mean Difference Tests *****************
ssc install ttable2
// Mean t - tests by Professors Li Chuntao and Zhang Xuan from Zhongnan University of Economics and Law
logout , save ( Filename ) word excel replace : ///
ttable2 price mpg trunk trunk weight length turn headroom , ///
by ( foreign ) f ( % 12 . 3 f )
************ Correlation Coefficient Tests *****************
logout , save ( Correlation_File_Name ) word excel replace : ///
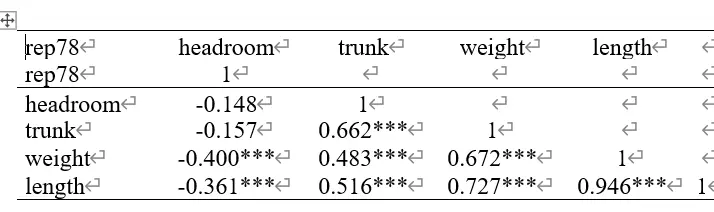
pwcorr_a rep78 headroom trunk weight length , ///
star1 ( 0 . 01 ) star5 ( 0 . 05 ) star10 ( 0 . 1 ) // Add * annotations
logout correlation coefficient output
Outreg2: Regression Output
For table outputs, I choose outreg2! Tables are aesthetically pleasing, support Word, and are convenient to export.
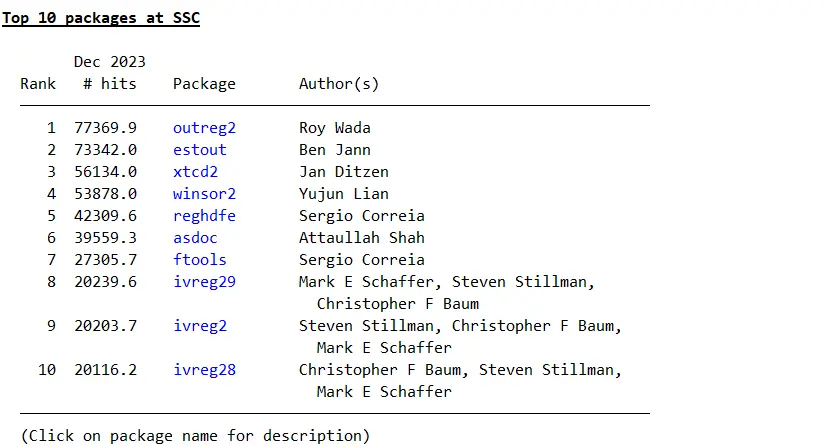
The command ssc hot, n(10) will show the top 10 most popular Stata commands. outreg ranks first!
Stata external command rankings
 1
 2
 3
 4
 5
 6
 7
 8
 9
10
11
12
13
14
15
16
17
18
ssc install outreg2 // Download command
webuse grunfeld , clear // Use default data
xtset company year // Define panel data
************ Descriptive Statistics *****************
outreg2 using Filename . doc , replace sum ( log ) keep ( company year invest mvalue kstock time ) eqkeep ( N min mix ) title ( Descriptive statistics )
************ Regression Results Output *****************
// Perform random effects , fixed effects , and mixed effects regression , then merge
// Starting a new table or merging corresponds to replace and append
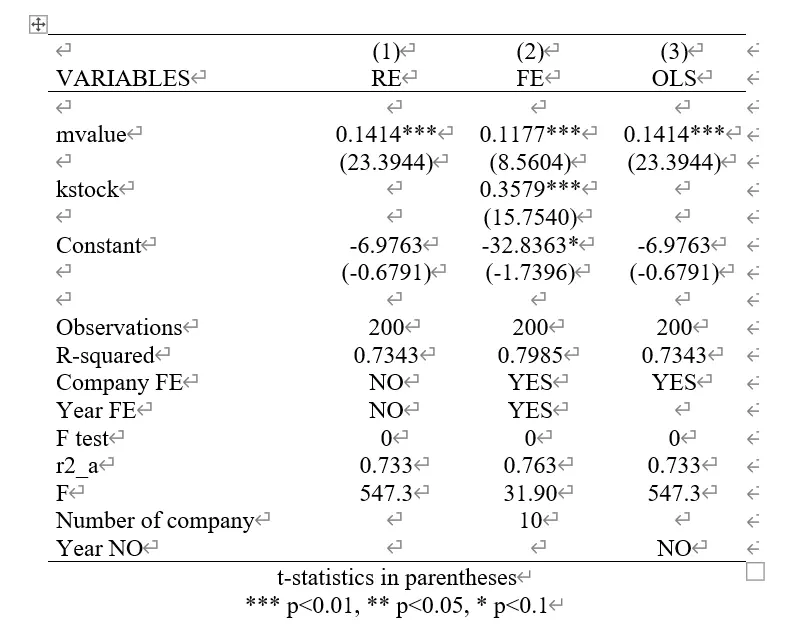
xtreg invest mvalue kstock , re
outreg2 using Filename . doc , replace tstat bdec ( 4 ) tdec ( 4 ) rdec ( 4 ) ctitle ( RE ) keep ( mvalue kstock ) e ( r2_a , F ) addstat ( F test , e ( p )) addtext ( Company FE , NO , Year FE , NO )
xtreg invest mvalue kstock i . year , fe
outreg2 using Filename . doc , append tstat bdec ( 4 ) tdec ( 4 ) rdec ( 4 ) ctitle ( FE ) keep ( mvalue kstock ) e ( r2_a , F ) addstat ( F test , e ( p )) addtext ( Company FE , YES , Year FE , YES )
reg invest mvalue
outreg2 using Filename . doc , append tstat bdec ( 4 ) tdec ( 4 ) rdec ( 4 ) ctitle ( OLS ) keep ( mvalue ) e ( r2_a , F ) addstat ( F test , e ( p )) addtext ( Company FE , YES , Year NO , NO )
// bdec ( 4 ) tdec ( 4 ) rdec ( 4 ) represent decimal places for coefficients , t - tests , and R ^ 2 respectively
// addstat and addtext correspond to adding statistics and table content
// keep ( var1 var2 var3 ) selects the output coefficients to keep
outreg2 regression output
Putdocx Series: Unified Solution
The docx series commands are developed by Crawler Club . Most of the above commands (not including asdoc) mean that a table output takes up a separate Word file. The docx series allows reusing a single file.
1
2
3
4
ssc install sum2docx , replace
ssc install corr2docx , replace
ssc install t2docx , replace
ssc install reg2docx , replace
The following example code is from “Jun Sheng Wo Wei Sheng! Stata Output: One-Click Paper Tables - reg2docx-corr2docx .”
 1
 2
 3
 4
 5
 6
 7
 8
 9
10
11
12
13
14
15
16
17
18
19
20
21
22
23
24
25
26
27
28
29
30
31
32
33
34
35
36
37
38
39
40
41
42
43
44
45
46
47
48
49
50
51
52
53
54
55
56
57
58
59
clear all
set more off
putdocx begin // Create a new Word document
putdocx paragraph , halign ( center ) // Center the paragraph
*- Define font , size , and basic settings
putdocx text ( "Attachment: Tables to be inserted in the article" ), ///
font ( "Huawei Kaiti" , 16 , black ) bold linebreak
*- Save the Word document as My_Table . docx
putdocx save "My_Table.docx" , replace
*- Load data
sysuse "auto.dta" , clear
* -----Table 1-----
sum2docx price - length using "My_Table.docx" , append ///
obs mean ( % 9 . 2 f ) sd min ( % 9 . 0 g ) median ( % 9 . 0 g ) max ( % 9 . 0 g ) ///
title ( "Table 1: Descriptive Statistics" )
*- Note : The append option adds this new table to the end of "My_Table.docx" .
* -----Table 2-----
putdocx begin
putdocx pagebreak
putdocx save "My_Table.docx" , append
corr2docx price - length using "My_Table.docx" , append ///
star ( * 0 . 05 ) fmt ( % 4 . 2 f ) ///
title ( "Table 2: Correlation Matrix" )
* -----Table 3-----
putdocx begin
putdocx pagebreak
putdocx save "My_Table.docx" , append
t2docx price - length using "My_Table.docx" , append ///
by ( foreign ) title ( "Table 3: Between-Group Mean Difference t-Test" )
* -----Table 4-----
putdocx begin
putdocx pagebreak
putdocx save "My_Table.docx" , append
reg price mpg weight length
est store m1
reg price mpg weight length foreign
est store m2
probit foreign price weight length
est store m3
reg2docx m1 m2 m3 using "My_Table.docx" , append ///
r2 ( % 9 . 3 f ) ar2 ( % 9 . 2 f ) b ( % 9 . 3 f ) t ( % 7 . 2 f ) ///
title ( "Table 4: Regression Results" )
shellout "My_Table.docx" // Done ! Open the generated Word document
Etable: Supports Chinese
The output command built into Stata 17 is not very user-friendly but seems to be the only one2 that supports Chinese encoding.
 1
 2
 3
 4
 5
 6
 7
 8
 9
10
11
12
13
14
15
16
17
18
19
20
21
22
23
24
25
26
27
28
29
30
31
clear
input str6 Gender Income Expenditure Others
"Male" 8 1 90
"Female" 9 2 21
"Female" 10 3 22
"Male" 11 4 31
"Male" 1 6 49
"Female" 2 7 95
"Female" 3 8 86
"Male" 4 9 17
end
reg Expenditure Income Others if Gender == "Male" , robust
est store Male_Regression
reg Expenditure Income Others if Gender == "Female" , robust
est store Female_Regression
reg Expenditure Income Others , robust
est store Overall_Regression
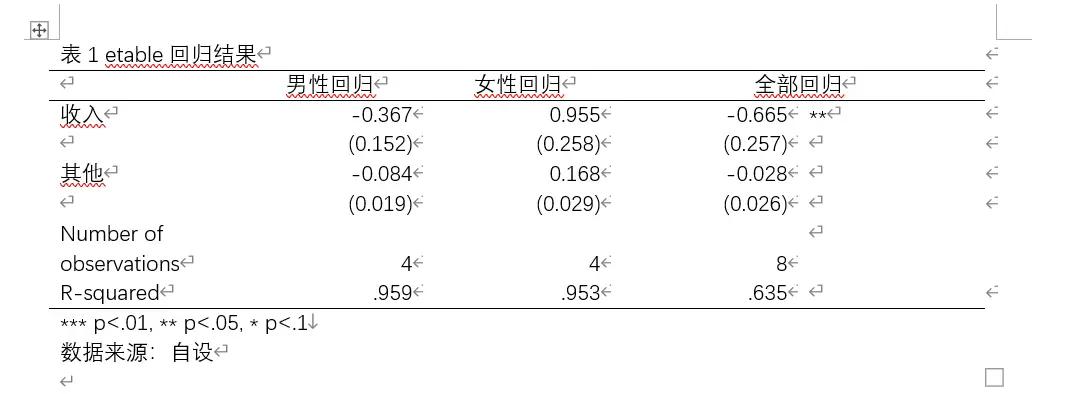
etable , estimates ( Male_Regression Female_Regression Overall_Regression ) column ( estimates ) keep ( Income Others ) ///
cstat ( _r_b , nformat ( % 9 . 3 f )) ///
cstat ( _r_se , nformat ( % 9 . 3 f )) ///
mstat ( N , nformat ( % 9 . 0 f )) ///
mstat ( r2 , nformat ( % 9 . 3 g )) ///
stars ( 0 . 10 "*" . 05 "**" . 01 "***" , attach ( _r_b )) ///
showstars showstarsnote ///
title ( "Table 1: Etable Regression Results" ) ///
note ( "Data source: custom" ) ///
export ( "Filename.docx" )
etable regression command
Code for Illustrations in This Article
From Crawler Club WeChat Account
 1
 2
 3
 4
 5
 6
 7
 8
 9
10
11
12
13
14
15
16
17
18
19
20
21
22
23
24
25
26
27
28
29
30
31
32
33
34
clear
set obs 12
gen x = _n
gen y = x + uniform ()
gen emoji = ustrunescape ( "\U0001f400" ) if x == 1
replace emoji = ustrunescape ( "\U0001f430" ) if x == 2
replace emoji = ustrunescape ( "\U0001f439" ) if x == 3
replace emoji = ustrunescape ( "\U0001f411" ) if x == 4
replace emoji = ustrunescape ( "\U0001f410" ) if x == 5
replace emoji = ustrunescape ( "\U0001f404" ) if x == 6
replace emoji = ustrunescape ( "\U0001f408" ) if x == 7
replace emoji = ustrunescape ( "\U0001f412" ) if x == 8
replace emoji = ustrunescape ( "\U0001f434" ) if x == 9
replace emoji = ustrunescape ( "\U0001f437" ) if x == 10
replace emoji = ustrunescape ( "\U0001f418" ) if x == 11
replace emoji = ustrunescape ( "\U0001f43a" ) if x == 12
scatter y x , msymbol ( none ) mlabel ( emoji ) mlabposition ( 0 ) mlabsize ( huge )
graph export animals . svg , replace
shellout animals . svg
Correlation coefficients seem to be outputtable only by logout.
All previous commands result in garbled text when loading Chinese variable names.