Sakana 小组件集成

目录

代码储存:python 年份、 stata 稳健性平行趋势检验

储存下 python、stata 的一个代码。

使用 python cv 包的一次体验

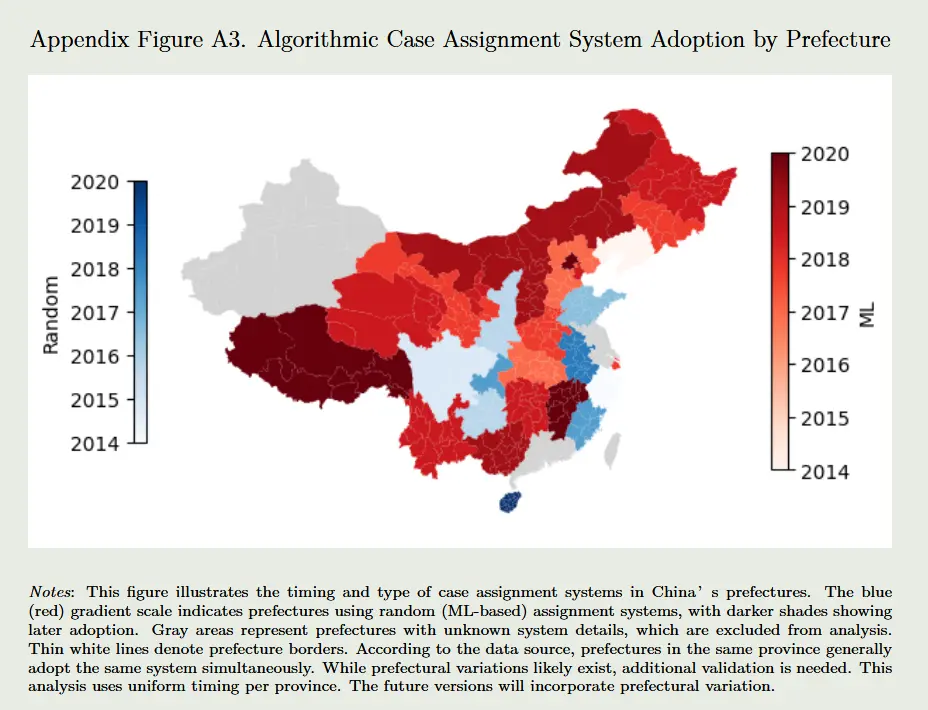
最近在研究法院随机分案。老师看到了一篇论文讨论随机分案的利弊——《Algorithm as Manager: How Algorithmic Judge-Case Assignment Influences Court Performance1

如何判断当地法院是否执行了随机分案?这位作者一个很聪明的做法是通过政府采购信息进行辨别,如果当地法院公共采购购买了随机分案系统,那么就执行了随机分案。按照作者的资料,目前法院有纯随机分案和机器学习两种方式。

我自己看了下政府采购,发现无法从里面获取法院采购随机分案系统,可能这也是作者粗糙处理到省级的原因。

目前作者只定位到了省级,假设省里面存在一个法院进行了随机分案,全省统一(图片注释说未来会更新到地区层面)。

/img/pythonGIS.zh-cn-20250524102004632.webp
如图

虽然肉眼也能看出来省级年份,但是为了方便以后我通过图像定位更细的颜色(理论上这篇论文的色彩分布应该具体到了季度层面?),同时早就想试试看 cv 包,所以通过 ai 尝试了下。

使用步骤如下:

  • 定位图片地址(不能包含中文)。
  • 框选两个色条(左侧和右侧),定位初始时间和最终时间。
  • 双击自己想要判断的像素点——直接得到对应的年份。

/img/pythonGIS.zh-cn-20250524102618436.webp
如图

完整代码如下(GPT 和 Gmini)联合生成:

  1
  2
  3
  4
  5
  6
  7
  8
  9
 10
 11
 12
 13
 14
 15
 16
 17
 18
 19
 20
 21
 22
 23
 24
 25
 26
 27
 28
 29
 30
 31
 32
 33
 34
 35
 36
 37
 38
 39
 40
 41
 42
 43
 44
 45
 46
 47
 48
 49
 50
 51
 52
 53
 54
 55
 56
 57
 58
 59
 60
 61
 62
 63
 64
 65
 66
 67
 68
 69
 70
 71
 72
 73
 74
 75
 76
 77
 78
 79
 80
 81
 82
 83
 84
 85
 86
 87
 88
 89
 90
 91
 92
 93
 94
 95
 96
 97
 98
 99
100
101
102
103
104
105
106
107
108
109
110
111
112
113
114
115
116
117
118
119
120
121
122
123
124
125
126
127
128
129
130
131
132
133
134
135
136
137
138
139
140
141
142
143
144
145
146
147
148
149
150
151
152
153
154
155
156
157
158
159
160
161
162
163
164
165
166
167
168
169
170
171
172
173
174
175
176
177
178
179
180
181
182
183
184
185
186
187
188
189
190
191
192
193
194
195
196
197
198
199
200
201
202
203
204
!pip install opencv-python
import cv2
import numpy as np
from scipy.interpolate import interp1d

# 全局变量
random_colors = None
random_interp = None
ml_colors = None
ml_interp = None
img_rgb = None           # 原始图片的 RGB 格式
img_raw = None           # 原始图片的 BGR 格式 (用于显示和临时绘图)
img_with_rois = None     # 带有永久绘制的 ROI 框的图片

# 全局变量用于 ROI 选择
roi_points = [] # 存储点击的 (x, y) 坐标
# ROI 选择阶段的状态机:
# 0: 准备选择 '随机分案' 色标的起点 (等待第一次点击)
# 1: 选择 '随机分案' 色标的终点 (第一次点击已发生,等待第二次点击)
# 2: '随机分案' 色标已选定,准备选择 '机器学习' 色标的起点 (等待第三次点击)
# 3: 选择 '机器学习' 色标的终点 (第三次点击已发生,等待第四次点击)
# 4: 两个色标均已选定,进入年份识别阶段
selecting_roi_state = 0

# 建立色标 → 年份的插值函数
# 参数:
#   roi: 图片中色标的区域 (numpy 数组,包含色标的像素数据)
#   year_min: 色标代表的最小年份 (例如: 2014)
#   year_max: 色标代表的最大年份 (例如: 2020)
#   debug_name: 用于调试输出的色标名称
# 返回值:
#   center_col: 色标中心列的 RGB 颜色序列 (N x 3 numpy 数组)
#   interp_func: 从像素在色标中的垂直位置 (索引) 到年份的插值函数
def build_color_axis(roi, year_min=2014, year_max=2020, debug_name="色标"):
    h = roi.shape[0] # 色标区域的高度
    # 从 ROI 中选取中心列的像素颜色。我们假设色标是垂直的。
    center_col = roi[:, roi.shape[1] // 2, :]

    # 确保年份从上到下(从 year_max 到 year_min)对应像素索引 (0 到 h-1)
    # 这样色条顶部 (索引 0) 对应 year_max (2020),底部 (索引 h-1) 对应 year_min (2014)
    years = np.linspace(year_max, year_min, h)

    print(f"\n--- 调试信息: {debug_name} ---")
    print(f"ROI 高度: {h} 像素")
    print(f"色标顶部颜色 (索引 0): {center_col[0]}, 预期年份: {years[0]:.2f}")
    print(f"色标底部颜色 (索引 {h-1}): {center_col[h-1]}, 预期年份: {years[h-1]:.2f}")
    print(f"插值映射: 索引 0 -> {year_max}, 索引 {h-1} -> {year_min}")
    print(f"示例年份 (顶部, 中间, 底部): {years[0]:.2f}, {years[h//2]:.2f}, {years[h-1]:.2f}")

    return center_col, interp1d(np.arange(h), years, bounds_error=False, fill_value="extrapolate")

# 匹配单个颜色到最近的色标颜色,并返回对应年份
# 参数:
#   sample_color: 要匹配的单个像素颜色 (1x3 numpy 数组,RGB 值)
#   color_axis: 预先建立的色标颜色序列 (N x 3 numpy 数组)
#   interp_func: 对应色标的插值函数
# 返回值:
#   年份 (浮点数)
def match_color_to_year(sample_color, color_axis, interp_func):
    # 计算样本颜色与色标颜色序列中所有颜色的欧几里得距离
    dists = np.linalg.norm(color_axis - sample_color, axis=1)
    idx = np.argmin(dists) # 找到距离最近的颜色在色标颜色序列中的索引
    # 使用插值函数将找到的索引转换为对应的年份
    return float(interp_func(idx))

# 鼠标点击事件处理函数 (年份识别阶段)
# 当用户点击图片时,此函数会被调用
def click_event(event, x, y, flags, param):
    if event == cv2.EVENT_LBUTTONDOWN: # 检查是否为鼠标左键点击事件
        global img_rgb, random_colors, random_interp, ml_colors, ml_interp

        # 确保必要的全局变量已经被初始化
        if img_rgb is None or random_colors is None or ml_colors is None:
            print("错误:图片或色标数据未载入。请确保已成功框选色标。")
            return

        print(f"\n点击位置: ({x}, {y})")
        # 获取点击位置的像素颜色 (RGB 值)
        clicked_color = img_rgb[y, x, :]
        print(f"点击像素颜色 (RGB): {clicked_color}")

        # 计算点击颜色与两个色标的最小距离
        random_dists = np.linalg.norm(random_colors - clicked_color, axis=1)
        ml_dists = np.linalg.norm(ml_colors - clicked_color, axis=1)

        random_dist = np.min(random_dists)
        ml_dist = np.min(ml_dists)

        print(f"与 '随机分案' 色标的最小距离: {random_dist:.2f}")
        print(f"与 '机器学习' 色标的最小距离: {ml_dist:.2f}")

        # 根据哪个色标的距离更小,决定点击的颜色属于哪种改革类型
        if random_dist < ml_dist:
            reform_type = "随机分案"
            # 使用 '随机分案' 的插值函数来获取年份
            reform_time = match_color_to_year(clicked_color, random_colors, random_interp)
        else:
            reform_type = "机器学习"
            # 使用 '机器学习' 的插值函数来获取年份
            reform_time = match_color_to_year(clicked_color, ml_colors, ml_interp)

        print(f"结果: {reform_type}, 年份: {reform_time:.2f}")

# 鼠标事件处理函数 (ROI 选择阶段)
# 此函数只负责记录点击点和绘制临时框,状态转换由主循环控制
def select_roi_event(event, x, y, flags, param):
    global roi_points, selecting_roi_state, img_raw, img_with_rois

    if event == cv2.EVENT_LBUTTONDOWN:
        roi_points.append((x, y))
        # 状态转换逻辑在 main 函数中根据 roi_points 的长度进行

    elif event == cv2.EVENT_MOUSEMOVE:
        # 在选择第一个 ROI 的第二个点时绘制临时框 (绿色)
        if selecting_roi_state == 0 and len(roi_points) == 1:
            temp_img = img_raw.copy() # 从原始图片复制,避免覆盖永久框
            cv2.rectangle(temp_img, roi_points[0], (x, y), (0, 255, 0), 1) # 绿色临时框
            cv2.imshow('点击获取年份 (请框选色标)', temp_img)
        # 在选择第二个 ROI 的第二个点时绘制临时框 (绿色)
        elif selecting_roi_state == 2 and len(roi_points) == 3:
            temp_img = img_with_rois.copy() # 从已绘制第一个 ROI 的图片复制
            cv2.rectangle(temp_img, roi_points[2], (x, y), (0, 255, 0), 1) # 绿色临时框
            cv2.imshow('点击获取年份 (请框选色标)', temp_img)

# 主函数
def main():
    global img_rgb, random_colors, random_interp, ml_colors, ml_interp, img_raw, img_with_rois, selecting_roi_state, roi_points

    # 图片路径
    img_path = 'D:/PyTorch_practice/map/x.png'
    img_raw = cv2.imread(img_path) # 载入图片 (以 BGR 格式)

    if img_raw is None:
        print(f"错误:图片载入失败,请检查路径: {img_path}")
        return

    img_rgb = cv2.cvtColor(img_raw, cv2.COLOR_BGR2RGB) # 将图片转换为 RGB 格式
    img_with_rois = img_raw.copy() # 创建一个副本用于显示和绘制永久 ROI 框

    cv2.namedWindow('点击获取年份 (请框选色标)')
    # 初始阶段设置鼠标回调函数为 ROI 选择模式
    cv2.setMouseCallback('点击获取年份 (请框选色标)', select_roi_event)

    print("--- 交互式色标框选 ---")
    print("步骤 1/2: 请框选 '随机分案' 色标 (左侧蓝色条)。")
    print("   点击色标的左上角,然后拖拽鼠标到右下角并释放。")

    # ROI 选择循环
    while selecting_roi_state < 4: # 当 selecting_roi_state 达到 4 时表示两个 ROI 都已选定
        cv2.imshow('点击获取年份 (请框选色标)', img_with_rois) # 持续显示带有永久 ROI 框的图片
        key = cv2.waitKey(1) & 0xFF
        if key == ord('q'): # 按 'q' 键退出
            cv2.destroyAllWindows()
            return

        # 根据 roi_points 的长度来管理状态转换
        if selecting_roi_state == 0 and len(roi_points) == 1: # 随机色标起点已点击
            selecting_roi_state = 1 # 进入等待随机色标终点的状态
            print("请框选 '随机分案' 色标的终点 (右下角)。")
        elif selecting_roi_state == 1 and len(roi_points) == 2: # 随机色标终点已点击
            # 绘制 '随机分案' 色标的永久矩形框 (蓝色)
            cv2.rectangle(img_with_rois, roi_points[0], roi_points[1], (255, 0, 0), 2)
            cv2.imshow('点击获取年份 (请框选色标)', img_with_rois) # 更新显示
            selecting_roi_state = 2 # 进入准备选择 '机器学习' 色标起点的状态
            print("\n步骤 2/2: 请框选 '机器学习' 色标 (右侧红色条)。")
            print("   点击色标的左上角,然后拖拽鼠标到右下角并释放。")
        elif selecting_roi_state == 2 and len(roi_points) == 3: # 机器学习色标起点已点击
            selecting_roi_state = 3 # 进入等待机器学习色标终点的状态
            print("请框选 '机器学习' 色标的终点 (右下角)。")
        elif selecting_roi_state == 3 and len(roi_points) == 4: # 机器学习色标终点已点击
            # 绘制 '机器学习' 色标的永久矩形框 (红色)
            cv2.rectangle(img_with_rois, roi_points[2], roi_points[3], (0, 0, 255), 2)
            cv2.imshow('点击获取年份 (请框选色标)', img_with_rois) # 更新显示
            selecting_roi_state = 4 # 两个 ROI 都已选定,退出循环

    # 色标选择完成后,提取坐标并建立颜色轴
    # 确保坐标是正确的 (x_start, y_start, x_end, y_end) 格式,并且 start <= end
    random_roi_coords = (min(roi_points[0][0], roi_points[1][0]), min(roi_points[0][1], roi_points[1][1]),
                         max(roi_points[0][0], roi_points[1][0]), max(roi_points[0][1], roi_points[1][1]))
    ml_roi_coords = (min(roi_points[2][0], roi_points[3][0]), min(roi_points[2][1], roi_points[3][1]),
                     max(roi_points[2][0], roi_points[3][0]), max(roi_points[2][1], roi_points[3][1]))

    # 从原始 RGB 图片中提取 ROI 图片数据
    random_roi = img_rgb[random_roi_coords[1]:random_roi_coords[3], random_roi_coords[0]:random_roi_coords[2]]
    ml_roi = img_rgb[ml_roi_coords[1]:ml_roi_coords[3], ml_roi_coords[0]:ml_roi_coords[2]]

    # 建立两个色标的颜色轴和插值函数
    random_colors, random_interp = build_color_axis(random_roi, debug_name="随机分案色标")
    ml_colors, ml_interp = build_color_axis(ml_roi, debug_name="机器学习色标")

    # 转换到年份识别阶段
    cv2.setMouseCallback('点击获取年份 (请框选色标)', click_event) # 将鼠标回调函数改为年份识别模式
    cv2.setWindowTitle('点击获取年份 (请框选色标)', '点击获取年份') # 更新窗口标题
    print("\n色标框选完成。现在请点击地图上的省份以获取年份。按 'q' 键退出。")

    # 年份识别循环
    while True:
        cv2.imshow('点击获取年份', img_with_rois) # 继续显示带有永久 ROI 框的图片
        if cv2.waitKey(1) & 0xFF == ord('q'):
            break
    cv2.destroyAllWindows()

if __name__ == '__main__':
    main()

代码异质性

Stata 关于 DID 的平行趋势稳健性检验方法。

来源:计量经济学圈公众号。一张图里画出5种异质性稳健DID的平行趋势与动态效应的完整code和示例

直接复制的话,排版不行;并且有些命令在 stata18 中更新,个人修改了一点细节。

/img/pythonGIS.zh-cn-20250524103449818.webp
如图,绘图风格使用的schemepack包的Rainbow风格(个人最爱的风格)

关于 did 异质性的理论讨论,推荐:

代码如下

  1
  2
  3
  4
  5
  6
  7
  8
  9
 10
 11
 12
 13
 14
 15
 16
 17
 18
 19
 20
 21
 22
 23
 24
 25
 26
 27
 28
 29
 30
 31
 32
 33
 34
 35
 36
 37
 38
 39
 40
 41
 42
 43
 44
 45
 46
 47
 48
 49
 50
 51
 52
 53
 54
 55
 56
 57
 58
 59
 60
 61
 62
 63
 64
 65
 66
 67
 68
 69
 70
 71
 72
 73
 74
 75
 76
 77
 78
 79
 80
 81
 82
 83
 84
 85
 86
 87
 88
 89
 90
 91
 92
 93
 94
 95
 96
 97
 98
 99
100
101
102
103
*ssc install drdid , replace
*ssc install schemepack, replace  
*ssc  install did_imputation  , replace
*ssc  install did_multiplegt  , replace
*ssc  install eventstudyinteract  , replace
*ssc  install csdid  , replace
* 生成模拟数据,创建一个包含300个单位、15个周期的完整面板数据
clear all
timer clear
set seed 10
global T = 15  // 全局变量T,表示观测周期数
global I = 300  // 全局变量I,表示单位数

set obs `=$I*$T'  // 设置观测总数为单位数乘以周期数
gen i = int((_n-1)/$T )+1  // 生成单位ID
gen t = mod((_n-1),$T )+1  // 生成日历周期
tsset i t  // 设置面板数据的时间序列格式

* 随机生成治疗滚动年份,在Ei=1016之间均匀分布(注意:t>=16的周期无用,因为所有单位在此之前都已接受治疗)
gen Ei = ceil(runiform()*7)+$T -6 if t==1  // 生成单位首次接受治疗的年份
bys i (t): replace Ei = Ei[1]  // 将首次治疗年份扩展到每个单位的所有周期
gen K = t-Ei  // 生成相对时间,即自治疗以来的周期数(若从未治疗则可能缺失)
gen D = K>=0 & Ei!=.  // 生成治疗指示变量,1表示已接受治疗

* 生成具有平行趋势和异质性治疗效应的结果变量
gen tau = cond(D==1, (t-12.5), 0)  // 异质性治疗效应(随日历周期变化)
gen eps = rnormal()  // 生成随机误差项
gen Y = i + 3*t + tau*D + eps  // 生成结果变量(固定效应不影响结果,因为所有方法都控制了固定效应)

* 使用 Borusyak et al. (2021)  did_imputation 方法进行估计
did_imputation Y i t Ei, allhorizons pretrend(5)  // 估计所有时间范围的事前趋势(5期)
event_plot, default_look graph_opt(xtitle("Periods since the event") ytitle("Average causal effect") ///
    title("Borusyak et al. (2021) imputation estimator") xlabel(-5(1)5))  // 绘制事件图

estimates store bjs  // 存储估计结果以供后续使用

* 使用 de Chaisemartin and D'Haultfoeuille (2020) 的 did_multiplegt 方法进行估计

did_multiplegt_old Y i t D, dynamic(5) placebo(5) breps(100) cluster(i) robust_dynamic  // 动态效应估计,含5期事后和5期安慰剂检验
* did_multiplegt dyn Y i t D, dynamic(5) placebo(5) breps(100) cluster(i) robust_dynamic
event_plot e(estimates)#e(variances), default_look graph_opt(xtitle("Periods since the event") ytitle("Average causal effect") ///
    title("de Chaisemartin and D'Haultfoeuille (2020)") xlabel(-5(1)5)) stub_lag(Effect_#) stub_lead(Placebo_#) together  // 绘制事件图

matrix dcdh_b = e(estimates)  // 存储估计结果
matrix dcdh_v = e(variances)  // 存储方差结果

* 使用 Callaway and Sant'Anna (2020) 的 csdid 方法进行估计
gen gvar = cond(Ei==., 0, Ei)  // csdid命令生成组变量(未治疗的单位设为0
csdid Y, ivar(i) time(t) gvar(gvar) notyet  // 估计因果效应
estat event, estore(cs)  // 生成并存储事件估计结果
event_plot cs, default_look graph_opt(xtitle("Periods since the event") ytitle("Average causal effect") xlabel(-14(1)5) ///
    title("Callaway and Sant'Anna (2020)")) stub_lag(Tp#) stub_lead(Tm#) together  // 绘制事件图

* 使用 Sun and Abraham (2020)  eventstudyinteract 方法进行估计
sum Ei
gen lastcohort = Ei==r(max)  // 生成最新或从未治疗的队列的虚拟变量
forvalues l = 0/5 {
    gen L`l'event = K==`l'  // 生成滞后事件虚拟变量
}
forvalues l = 1/14 {
    gen F`l'event = K==-`l'  // 生成提前事件虚拟变量
}
drop F1event  // 归一化K=-1(以及K=-15)为零
eventstudyinteract Y L*event F*event, vce(cluster i) absorb(i t) cohort(Ei) control_cohort(lastcohort)  // 交互估计
event_plot e(b_iw)#e(V_iw), default_look graph_opt(xtitle("Periods since the event") ytitle("Average causal effect") xlabel(-14(1)5) ///
    title("Sun and Abraham (2020)")) stub_lag(L#event) stub_lead(F#event) together  // 绘制事件图

matrix sa_b = e(b_iw)  // 存储估计结果
matrix sa_v = e(V_iw)  // 存储方差结果

* 使用 TWFE OLS 方法进行估计(由于治疗效应同质性,此处结果正确)
reghdfe Y F*event L*event, a(i t) cluster(i)  // 双固定效应回归
event_plot, default_look stub_lag(L#event) stub_lead(F#event) together graph_opt(xtitle("Days since the event") ytitle("OLS coefficients") xlabel(-14(1)5) ///
    title("OLS"))  // 绘制事件图

estimates store ols  // 保存估计结果

* 构建真实平均治疗效应的向量,按自治疗以来的周期数计算
matrix btrue = J(1,6,.)  // 创建一个1x6的空矩阵
matrix colnames btrue = tau0 tau1 tau2 tau3 tau4 tau5  // 设置列名
qui forvalues h = 0/5 {
    sum tau if K==`h'  // 计算每个相对时间点的平均治疗效应
    matrix btrue[1,`h'+1]=r(mean)  // 填充矩阵
}
set scheme Rainbow    
* 在一张图中展示所有估计值的事前趋势与事后动态效应
event_plot btrue# bjs dcdh_b#dcdh_v cs sa_b#sa_v ols, ///
    stub_lag(tau# tau# Effect_# Tp# L#event L#event) stub_lead(pre# pre# Placebo_# Tm# F#event F#event) plottype(scatter) ciplottype(rcap) ///
    together perturb(-0.325(0.13)0.325) trimlead(5) noautolegend ///  // 设置绘图参数
    graph_opt(title("Event study estimators in a simulated panel (300 units, 15 periods)", size(medlarge)) ///
        xtitle("Periods since the event") ytitle("Average causal effect") xlabel(-5(1)5) ylabel(0(1)3) ///
        legend(order(1 "True value" 2 "Borusyak et al." 4 "de Chaisemartin-D'Haultfoeuille" ///
            6 "Callaway-Sant'Anna" 8 "Sun-Abraham" 10 "OLS") rows(3) region(style(none))) ///
        xline(-0.5, lcolor(gs8) lpattern(dash)) yline(0, lcolor(gs8)) graphregion(color(white)) bgcolor(white) ylabel(, angle(horizontal)) ///
    ) ///
    lag_opt1(msymbol(+) color(cranberry)) lag_ci_opt1(color(cranberry)) ///  // 自定义绘图样式
    lag_opt2(msymbol(O) color(cranberry)) lag_ci_opt2(color(cranberry)) ///
    lag_opt3(msymbol(Dh) color(navy)) lag_ci_opt3(color(navy)) ///
    lag_opt4(msymbol(Th) color(forest_green)) lag_ci_opt4(color(forest_green)) ///
    lag_opt5(msymbol(Sh) color(dkorange)) lag_ci_opt5(color(dkorange)) ///
    lag_opt6(msymbol(Oh) color(purple)) lag_ci_opt6(color(purple))

graph export "five_estimators_example.png", replace  // 导出图形

分享两个有趣的 stata 命令

Manyiv

Stata 命令下载:

1
net install manyiv, from("https://raw.githubusercontent.com/gphk-metrics/stata-manyiv/main/")

使用例子如下:

1
2
3
clear
sysuse auto
manyiv price ( trunk = weight ), absorb( gear_ratio ) absorbiv( foreign ) forcejive

然后你就会得到各种改进版的 iv 估计结果(适合凑工作量)2

1
2
3
4
5
6
7
8
9
           Coef.      Hetero
           -----      ------
   OLS  152.3933  (101.9636)
  TSLS  560.1103  (370.5976)
  LIML  600.0703  (383.4885)
MBTSLS  635.8036  (395.9637)
  JIVE  946.7464  (841.9874)
 UJIVE  648.4012  (405.8049)
 RTSLS  645.6237         (.)
方法 对工具变量强度的敏感性 样本量要求 典型使用场景
OLS (普通最小二乘) 不使用工具变量 无特殊要求 对照基准
TSLS (两阶段最小二乘) 对弱工具高度敏感;弱时估计显著偏向OLS 需要中大型样本以获得较好性质 标准 IV 分析
LIML (有限信息极大似然) 相对不敏感于弱工具;可设计权重近似消除2SLS偏差 适用于大型样本和多工具情形 多个(且可信)工具变量时,对抗弱工具偏差
MBTSLS (改进偏差TSLS) 适用于多工具场景;修正弱工具偏差 需要较大样本来估计偏差修正项 存在众多工具或潜在仪器失效时
JIVE (Jackknife IV) 减少弱工具偏差,可在多工具下保持一致 中大型样本(因 leave-one-out 特性) 许多工具、异方差存在或需消除2SLS偏差
UJIVE (无偏 JIVE) 类似 JIVE,尤其针对处理效应异质情形 中大型样本 关注局部平均处理效应、多工具与异质效应场景
RTSLS (逆向 TSLS) 敏感度同 TSLS;效应异质时估计不稳定 无特殊要求,但结果常不可靠 一般不常用,仅适用于特殊对称模型假设

上面这个表格主要是顺便测试下对比下 GPT 和 grok3 的搜集能力,GPT 的更好所以放上来了。

重点说明下 JIVE(Jackknife IV),其实就是每个样本省略当前行。例如对于第 n 行,使用 n-1 个样本进行工具变量分析。同理,每个观测点都删去自己一行进行观察。这个方法是诺奖得主 J. D. Angrist 提出的。在法律经济学相关研究中,这个工具变量用的比较多,考虑每个法官具有异质性需要控制个体效应,此时比较适合用这种方法。

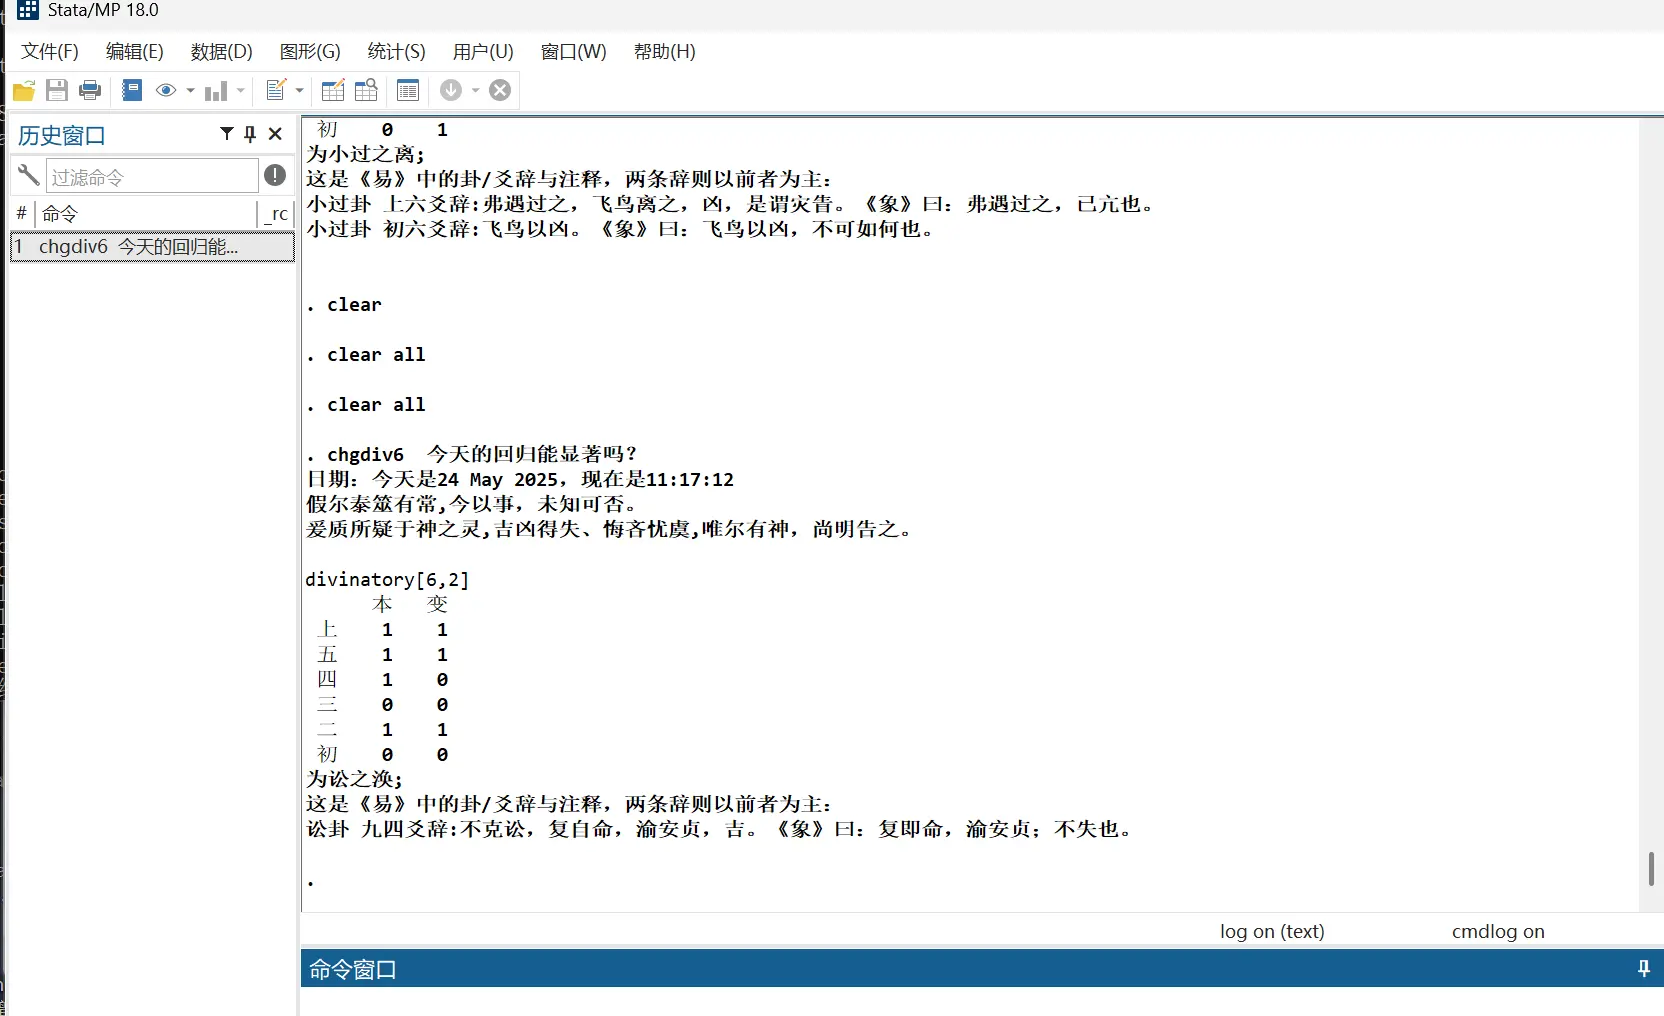
chgdiv6命令:在Stata中算铜钱卦

/img/pythonGIS.zh-cn-20250524111744270.webp
如图

回归前来点玄学,详细参见

 1
 2
 3
 4
 5
 6
 7
 8
 9
10
11
【常规版】适合自己能解卦的

  net install chgdiv6, from(https://gitee.com/chenshaoxuemei/chgdiv6/raw/master) replace 

【chat版】适合不会解卦的

  net install chgdiv6_chat, from(https://gitee.com/chenshaoxuemei/chgdiv6_chat/raw/master) replace 
  
  【备份版】一键下载两个命令(更加隐蔽)

net install chgdiv6_bkp, from(https://gitee.com/chenshaoxuemei/chgdiv6_bkp/raw/master) replace

命令例子

1
2
3
4
5
6
chgdiv6
\\当前时间起卦
chgdiv6 114514
\\数字起卦
chgdiv6 我买彩票能中一百万吗?
\\问题起卦

  1. 独作处理政府采购数据和裁判文书数据,感觉作者也太能肝了。 ↩︎

  2. 遗憾的是这个命令似乎没有很多的适配输出文档的架构 ↩︎