R 语言笔记 2 : 数据清洗、绘图与计量

推荐的学习资源在 R语言笔记1界面介绍与语法结构
常用数据库和清洗思想已经在 stata 版本介绍过了,这里重点记录 R 语言数据清洗常用代码。
在整理的过程中我反复感受到开源的力量。所有的处理都有 R 语言原生的技巧,但总会冒出各种包让你更省事,所以,
即便引导已经破碎,也请你成为调包之王!
数据清洗
工作目录
|
|
数据导入
表格出处:《数据科学中的 R 语言》
| 格式 | 命令 |
|---|---|
| .txt | read.table() |
| .csv | read.csv() and readr::read_csv() |
| .xls and .xlsx | readxl::read_excel() and openxlsx::read.xlsx() |
| .sav (SPSS files) | haven::read_sav() and foreign::read.spss() |
| .Rdata or rda | load() |
| .rds | readRDS() and readr::read_rds() |
| .dta | haven::read_dta() and haven::read_stata() |
| .sas 7 bdat (SAS files) | haven::read_sas() |
| Internet | download.file() |
遇到中文乱码则加入编码
|
|
参考来源 《统计分析(以R语言为工具):辅助材料》
|
|
手动输入:
|
|
批量合并的 excel 和 CSV 代码
|
|
查看数据类型
|
|
修改变量名
最减简单的方法——select
注意!我们是想把年份改成 year ,等式为 year = 年份!
如果文件含有特殊符号,使用``符号包围
|
|
顺便提一下复杂的改名方式( R 语言基本语法):
|
|
如果变量太长,我们不知道要修改的数据变量在第几列,请使用 names(中国城市数据库),结果会展示变量名和其对应列数。
创建新变量
推荐使用方法一
方法一
|
|
方法二
|
|
方法三
|
|
截取与添加字符
新建变量 x ,截取变量 var 第一个位置开始,长度为 4 的字符串
|
|
数据类型转换
包括日期的转换
|
|
时间日期相关
日期转换
|
|
日期提取
|
|
日期计算
|
|
排序、选择与分组
筛选行
|
|
筛选列
|
|
排序
|
|
分组处理
|
|
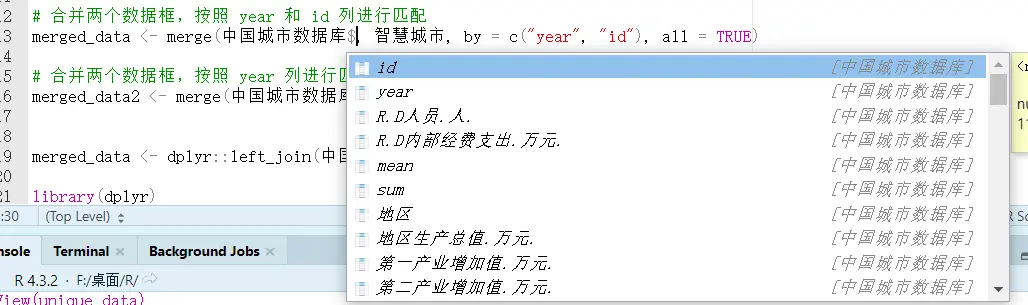
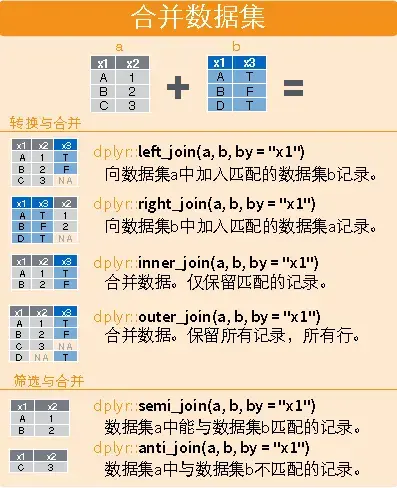
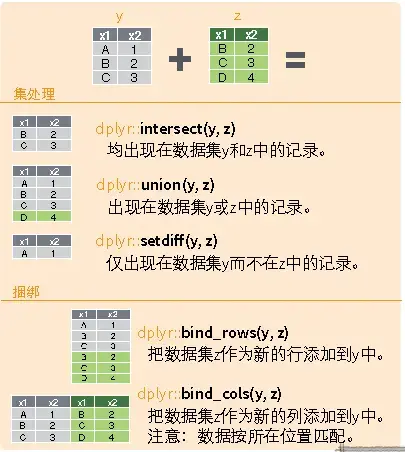
匹配合并
虽然 R 语言自带 merge ,和 stata 的 merge 类似,但功能更弱且只能进行一对一匹配,这里推荐使用 dplyr 包。
|
|
异常值处理
删除重复值
|
|
数据插补
na.rm = TRUE 是一个参数,通常用于在对数据进行计算时指定是否移除缺失值。当 na.rm 参数设置为 TRUE 时,函数会在计算前移除数据中的缺失值;而当设置为 FALSE 或省略时,函数将包含缺失值并返回结果为 NA。
截面插值
|
|
面板插值
参考 stata 的插值命令,在 R 中找到了相似的插入方法
|
|
缩尾处理
参考 R语言与Stata等价命令-statar,使用 statar 包。
将超过特定范围的值,替换为特定范围边界对应的值。
|
|
数据删除
删除空白值,问卷不适用值。
由于 stata 一次性只能操作一张表,所以都是在一张表上增减,但是 R 语言支持多张表操控,所以实际上是通过截取合适数据形成一张新的表来达成筛选目的。
|
|
绘图
Ggplot 2 就是分治画图,所以语法组成就是 $$ 步骤1(指定数据库,指定坐标轴)+步骤2(指定图像类型)+图像3(装饰)+组合4(……) $$ Ggplot 2 的作图一般步骤为:
- 准备数据,一般为数据框,且一般为长表,即每个观测时间占一行,每个观测变量占一列。
- 将数据输入到
ggplot()函数中,并指定参与作图的每个变量分别映射到哪些图形特性,比如映射为 x 坐标、y 坐标、颜色、形状等。这些映射称为 aesthetic mappings 或 aesthetics。 - 选择一个合适的图形类型,函数名以
geom_开头,如geom_point()表示散点图。图形类型简称为 geom。将ggplot()部分与geom_xxx()部分用加号连接。到此已经可以作图,下面的步骤是进一步的细化设定。 - 设定适当的坐标系统,如
coord_cartesian(),scale_x_log10()等。仍用加号连接。 - 设定标题和图例位置等,如
labs()。仍用加号连接。
这个流程的一个大致的模板为:
|
|
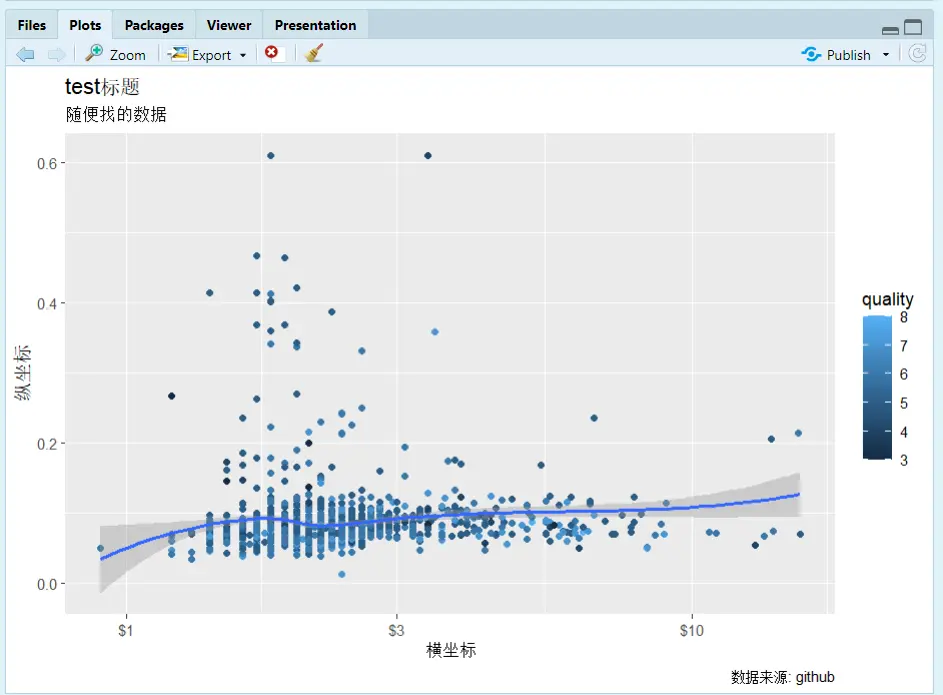
散点图与折线图
感觉语法上确实不如 stata 简洁好用(
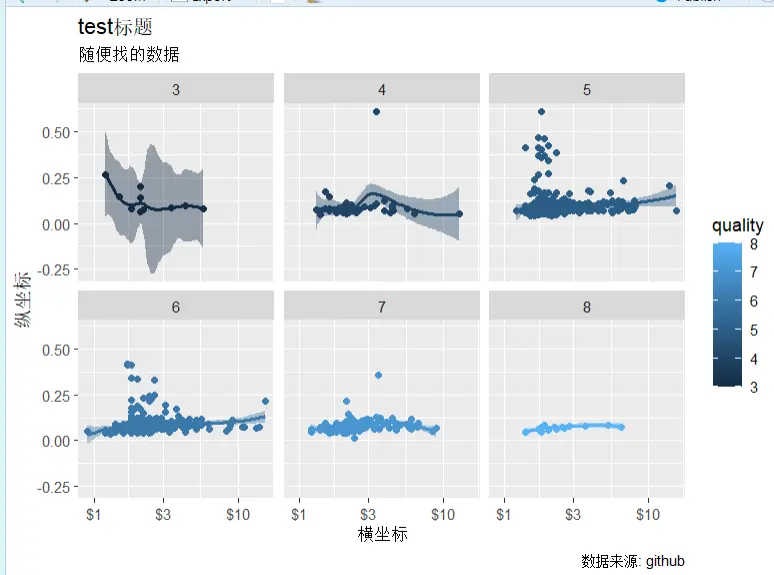
geom_point(): 散点,同理,加折线图就是geom_line()geom_smooth(): 拟合线scale_x_log10:横坐标以 10 为低对数化color = quality按照quality变量分组填充颜色facet_wrap(~ quality)按照quality变量进行切片分组,也可以变成(a~b),就是二维分组。也可以使用facet_grid(行变量 ~ 列变量)。
|
|
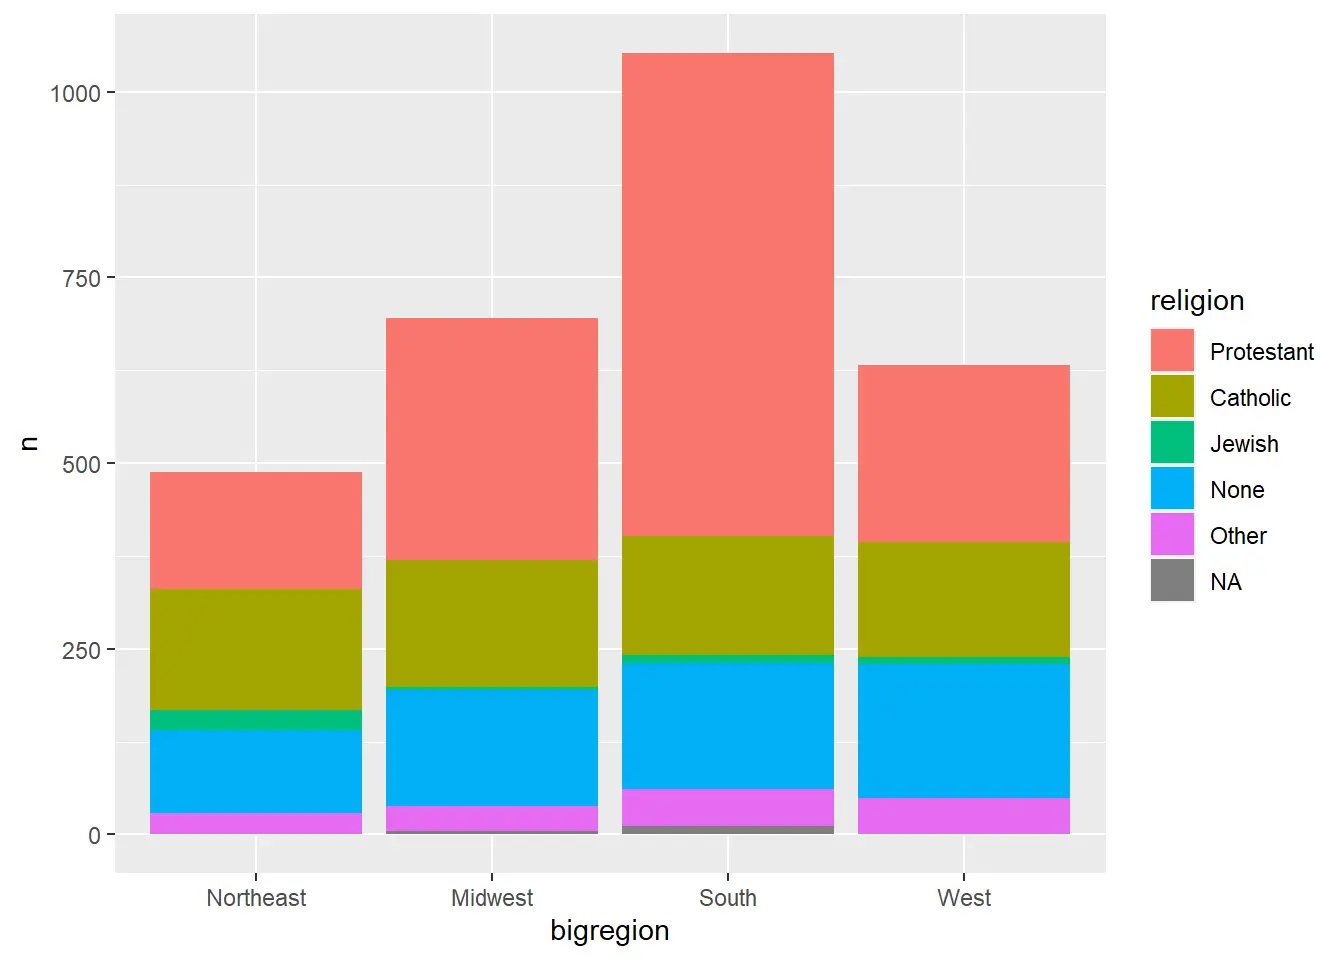
条形图
|
|
内部再分组的条形图
|
|
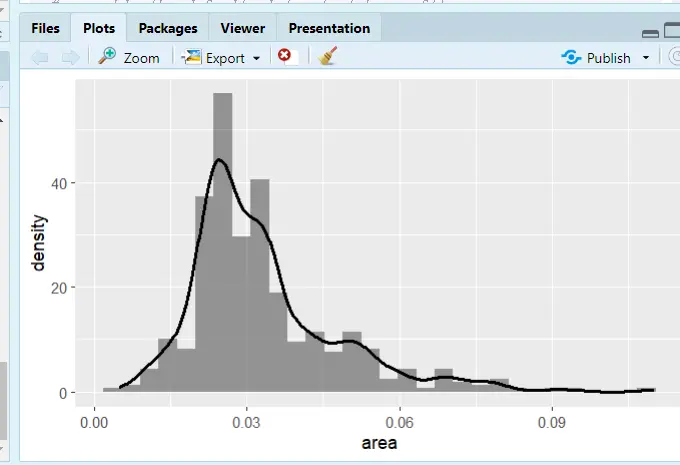
直方图
|
|
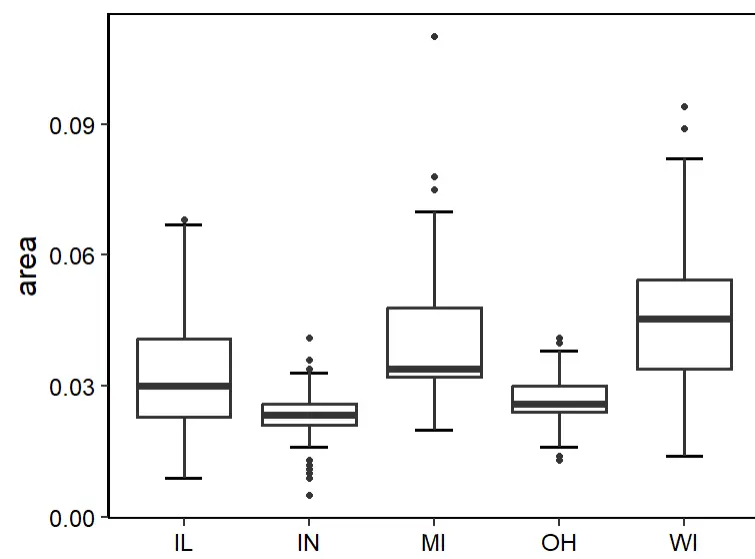
箱型图
|
|
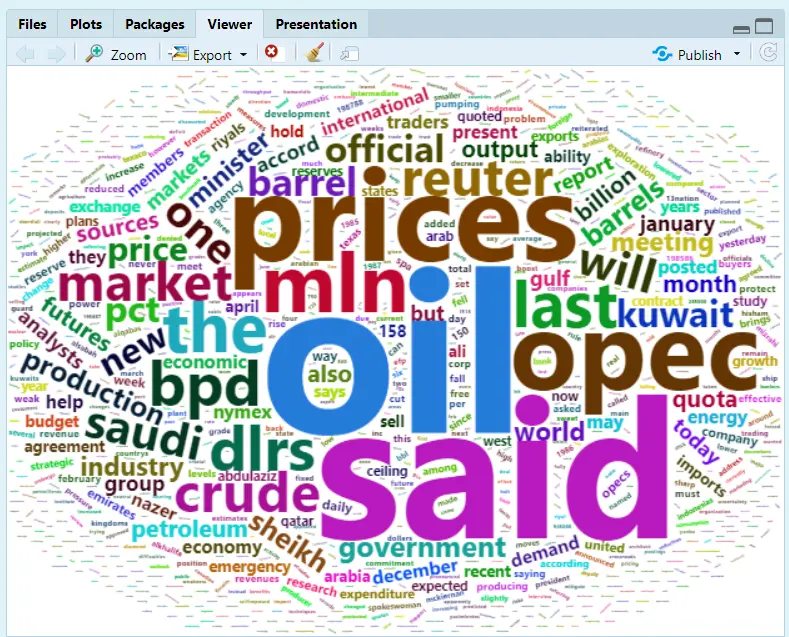
词云
|
|
相关系数热力图
参考 R语言绘制相关性热图
|
|

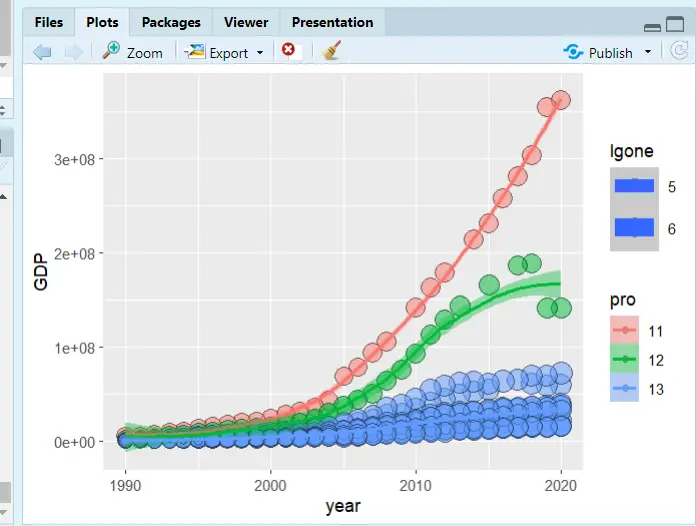
气泡图
|
|
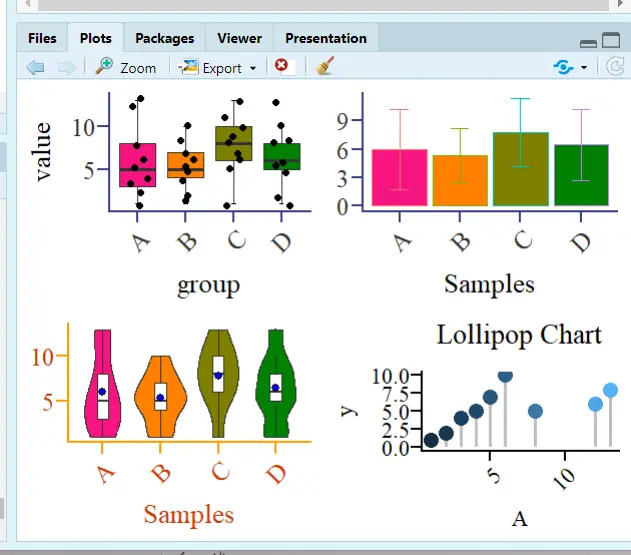
图片合并
加载包和绘图
|
|
组合图片
|
|
计量
推荐包,知乎大佬@ 包寒吴霜开发的 bruceR 包,开发目的还是为了取代 spss !我经常看大佬关于回归的文章分享,在大佬看来,经济学的回归只是一般/广义/多层线性模型的特殊变形。
由于 R 语言主要是生物医学统计在用,主流的 R 包三线表和经济学的三线表要求并不相同。
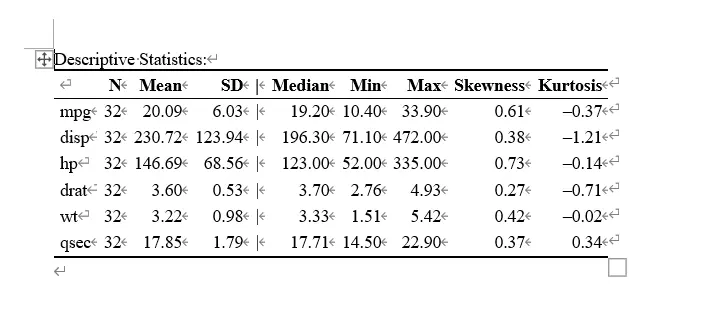
描述性统计和输出
描述统计
|
|
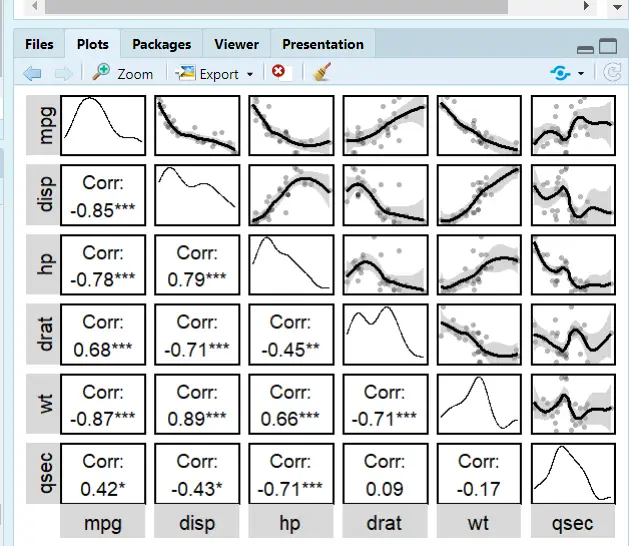
相关性分析
大佬开发的包真是恐怖如斯!简短优雅还高效!
还是继续用 Describe 命令
|
|
回归和 word 输出
回归
robust="HC1": 稳健性模式设置,HC 1 就是 stata 中的reg y x,rcluster="stratum": 和 stata 相同, cluster 是层次聚类解决自相关family=binomial: 是否二项回归
|
|
回归输出
bruceR 包是将 reg 的三线表输出并入到了广义多层次回归中,
下面两个回归代码是等价的:
|
|
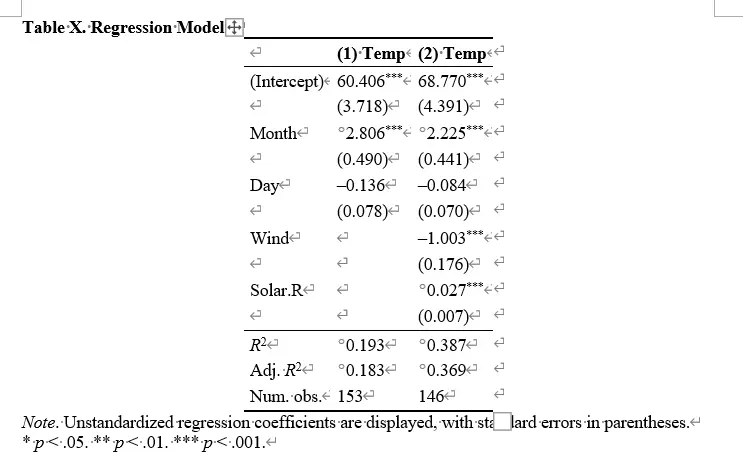
所以通过 lm 模型来输出回归结果:
|
|